
Figure 3.
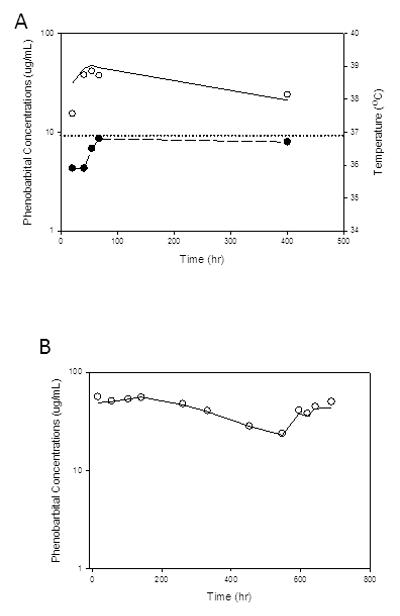
Individual observed phenobarbital concentration-time profiles and model prediction from A) hypothermia and B) normothermia subjects. Open circle – observed phenobarbital concentrations; solid line – model predicted phenobarbital concentrations; solid circle with dashed line – body core temperature of hypothermia subject; dotted line – normal core temperature.