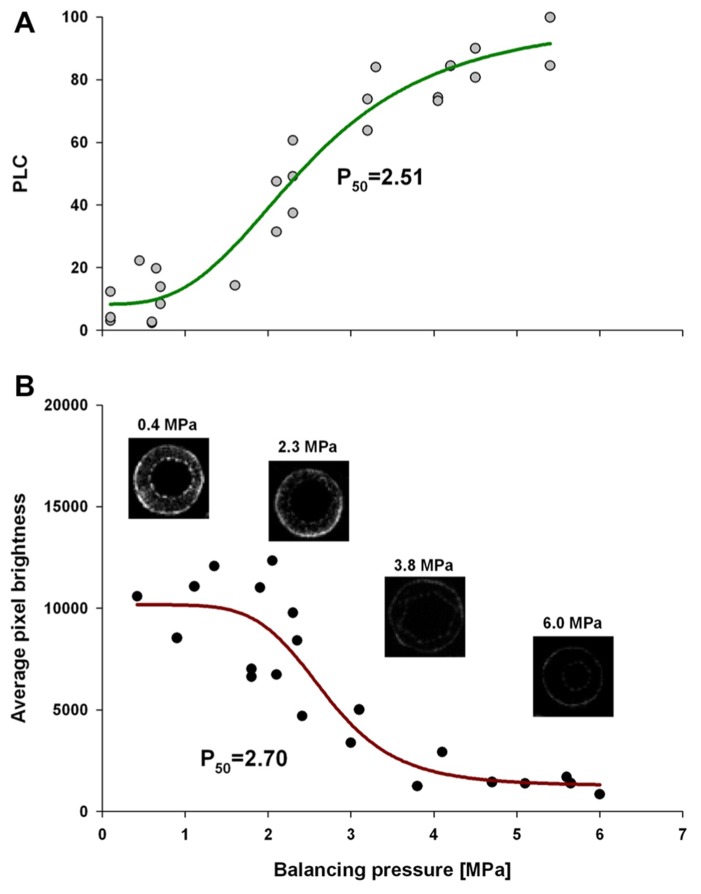
FIGURE 1.
Leaf water potential, measured on equilibrated branches, are plotted to PLC (A), and average pixel brightness (black = 0 to white = 65525) determined from MRI analysis (B), is shown. Both data sets were fitted with a dose–response curve (solid line) in the form of PLC = minPLC + (maxPLC - minPLC)/[1 + (C/EC50)slope], where minPLC is minimum PLC in non-stressed plants, maxPLC is 100%, EC50 represents 50% loss of initial functionality [minPLC + (maxPLC - minPLC)/2], and slope is the rateof PLC increase at EC50. There was no statistical difference between EC50 from two methods (PLC and MRI). The same function was used for pixel brightness curve fitting except that minPLC and maxPLC were substituted with average pixel brightness at low and high ends of stem water stress. The four MRI images shown are representative images that were used to create the MRI-vulnerability curve. Only pixel brightness data from the xylem conducting area was used to produce the curve. All measurements were made on current-year extension growth.

