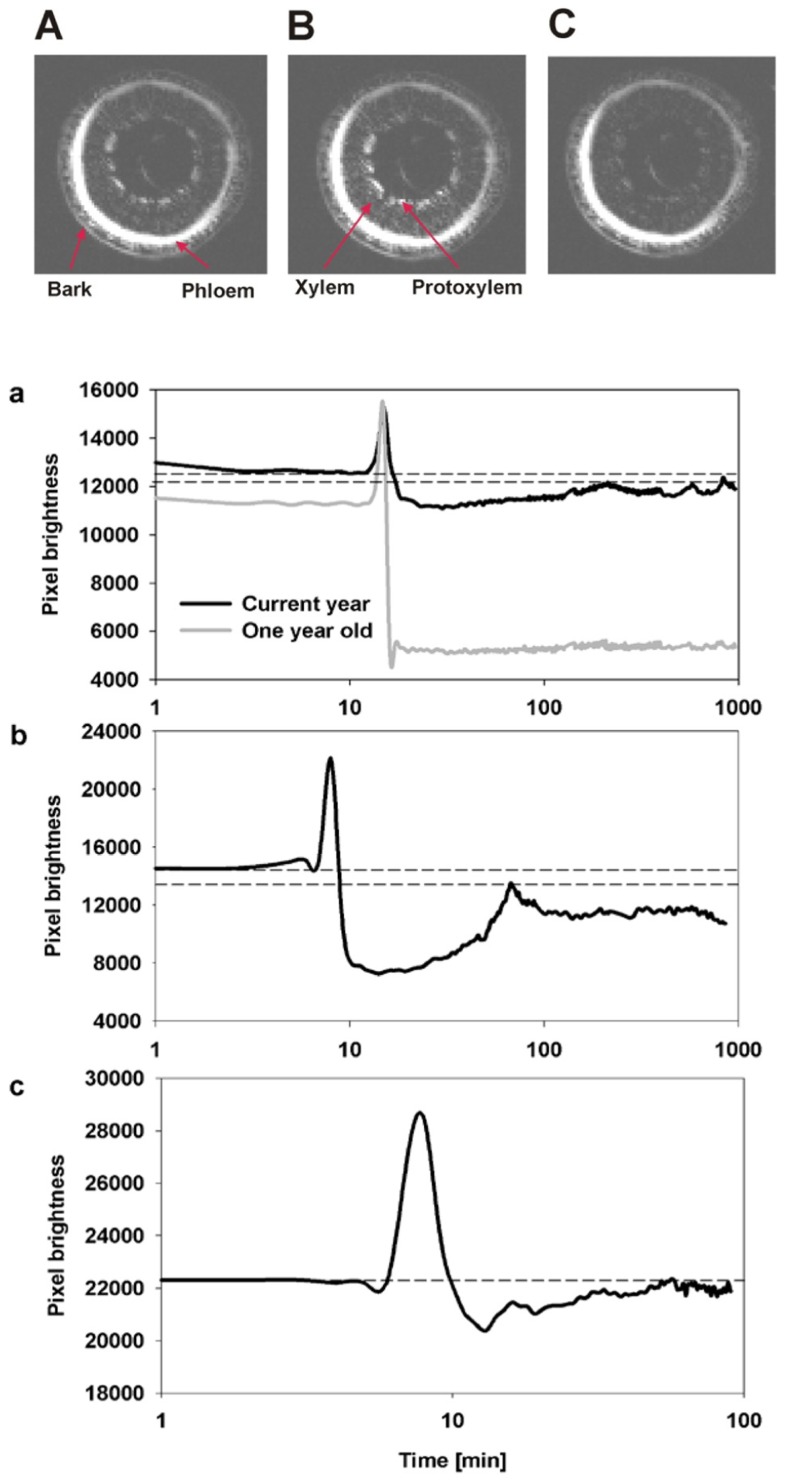
FIGURE 2.
Representative MRI images of three consecutive observations of the state of water status of xylem from current-year extension growth (A) before air injection, (B) during air injection, and (C) 10 min after air injection are shown. The images (A,C) reflect the changes in pixel brightness after the successful induction of embolism from air injection. The temporal increase of brightness observed in image (B) compared to (A,C) reflects the movement of water during the injection of air into the stem. The three figures below (a–c) are an analysis of changes in the average pixel brightness measured on the xylem conducting area from three experimental plants. Panel (a) displays analysis of two xylem growth rings simultaneously, and shows a lack of refilling in the 1-year-old ring as seen by the drop in average brightness to a new lower constant level while refilling was observed in the current-year growth ring as shown by the initial decrease in pixel brightness followed by a period of brightness increase. Panels (b,c) are measurements on current extension growth only and both show refilling following air injectionasthe initial decrease in pixel brightness is followed by an increase in pixel brightness. Dashed lines reflect the initial (prior to embolism induction) and the maximum final (recovered) levels of pixel brightness.

