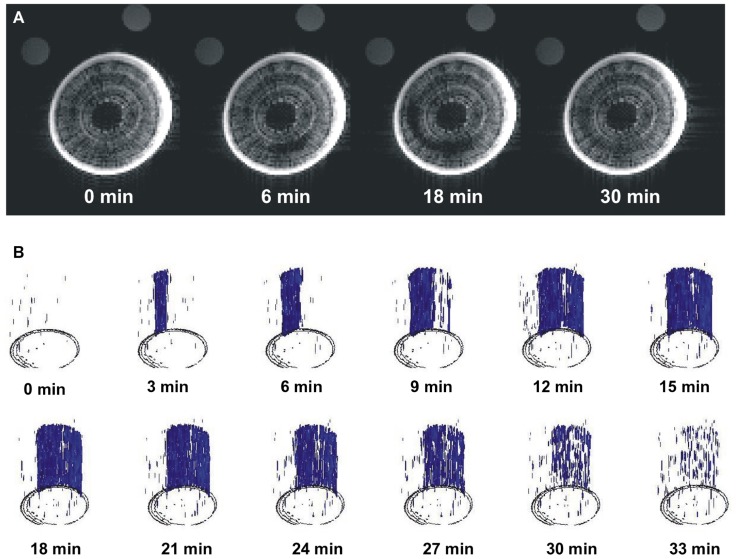
FIGURE 3.
Images of real-time MRI observations of a section of stem from an intact A. rubrum plant exposed to moderate levels of water stress. (A) Images show the development of a spontaneously occurring embolism (at 6 min) and its spread across the current growth ring (at 18 min) followed by an almost full water content recovery (at 30 min). (B) Three dimensional analyses of embolism formation, its spatial spread, and recovery. The blue color denotes volumes with 90% loss of pixel brightness. Please note that to improve embolus visibility, images were reoriented in respect to the MRI images. Please consult the Supplementary Material online (Video S1 and S2).

