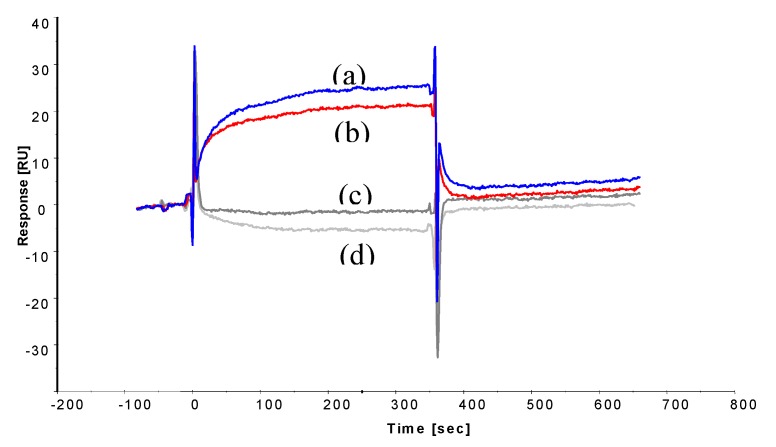
Figure 4.
Sensorgrams displaying binding curves of 100 mg L−1 (0.15 μM) ochratoxin A-BSA (reference subtracted) to immobilised peptides, (a) 13-mer peptide GPAGIDGPAGIRC (blue) and (b) octapeptide CSIVEDGL (red); and 100 mg L−1 BSA alone (negative control) binding to (c) 13-mer peptide (dark grey) and (d) octapeptide (light grey).

