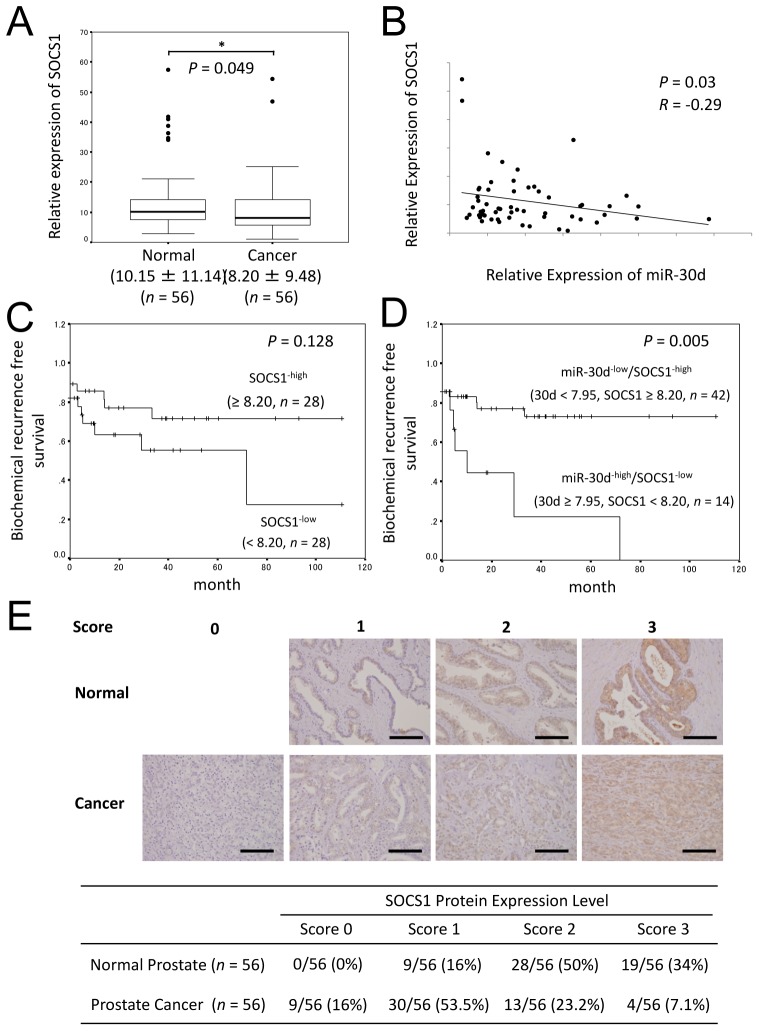
Figure 7. The relationship between miR-30d and SOCS1 expression are associated with early biochemical recurrence.
(A) qPCR analysis of SOCS1 expression levels in PCa surgical specimens obtained from radical prostatectomy (n = 56). The expression level of miR-30d was normalized to the expression level of the housekeeping gene RNU6B. Values indicate the medians ± SD. *P < 0.05 according to the Wilcoxon signed-ranks test. (B) Correlation between the expression level of SOCS1 and that of miR-30d in PCa tissue (n = 56). The y-axis indicates the relative expression levels of SOCS1 mRNA, with actin serving as the internal control; the x-axis indicates the relative expression levels of miR-30b, with RNU6B serving as the internal control. The liner regression coefficient and statistical significance are indicated. P = 0.03 and R = −0.29 according to the Pearson correlation coefficient test (R = correlation coefficient). (C) The Kaplan-Meier and log-rank test (n = 56) were used to analyze the data. Two groups were formed according to the median value (high: ≥ 8.20, n = 28; low: < 8.20 (a.u.), n = 28) of the SOCS1 expression levels and analyzed (P = 0.128; log-rank test) to determine its association with biochemical recurrence in PCa. (D) Kaplan-Meier and log-rank analysis (n = 56). The 2 groups were divided according to the median value (miR-30d < 7.95; SOCS1 ≥ 8.20 (a.u.); n = 42) and analyzed (P = 0.0057; log-rank test) to determine its association with biochemical recurrence in PCa. (E) Immunohistochemical analysis of SOCS1 in PCa comparing adjacent normal prostate tissues and surgical specimens obtained from the same patients during radical prostatectomy. The results of the immunohistochemical study were estimated using a 4-grade scoring system: 0, negative; 1, focally and weakly positive: 2, diffusely weak or focally intense positive: 3, diffusely and intensely positive. Estimates were determined by 2 independent pathologists. The immunohistochemical stainings were categorized as 0–1 (negative) or 2–3 (positive; χ2 test; P < 0.001). Bar = 100 μm.

