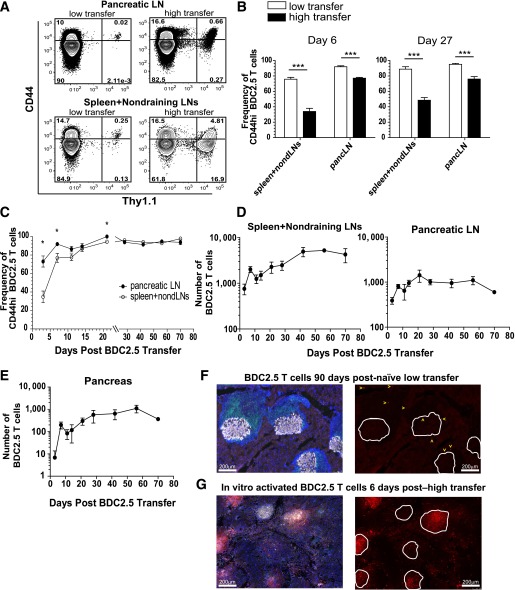
FIG. 1.
Establishment of a novel model to assess natural breakdown of peripheral tolerance using a physiologically relevant and traceable autoreactive T-cell population. A: Representative flow cytometry contour plots are shown from the spleen and nondraining LNs comparing CD44 expression on the endogenous CD4+ T-cell population (Thy1.1−) with transferred BDC2.5 T cells (Thy1.1+) at day 6 after transfer of 7,500 (low transfer) or 1 × 10⁶ (high transfer) BDC2.5 T cells. B: Quantification of the frequency of BDC2.5 T cells that were CD44high at days 6 and 27 after transfer of 7,500 or 1 × 10⁶ BDC2.5 T cells in the spleen and nondraining LNs and pLN. Data from A and B are representative of two independent experiments with three to five mice per group. C: Quantification of the frequency of CD44high BDC2.5 T cells at various time points (x-axis) between the pLN and the spleen and nondraining LNs after transfer of 7,500 cells. D: The absolute number of BDC2.5 Thy1.1+ T cells in the spleen and nondraining LNs and pLN at various time points over 70 days after low transfer into prediabetic NOD.Thy1.2 mice. All mice shown were nondiabetic at the time of harvest. Nondraining LNs included inguinal, axillary, brachial, cervical, and periaortic. E: The absolute number of BDC2.5 T cells in the pancreas of mice shown in D after low transfer into NOD mice. Data for C–E are representative of two independent experiments with three to four mice per time point. F: Histological analysis of the pancreas from nondiabetic mice 90 days posttransfer of BDC2.5 T cells. Images are representative of four mice 90–114 days posttransfer. G: Histological analysis of the pancreas from NOD mice 5–7 days posttransfer of 2.5 × 10⁶ in vitro activated BDC2.5 T cells at T1D onset. Images are representative of five mice. Insulin is gray, Thy1.1+ BDC2.5 T cells are red, CD3+ T cells are green, and DAPI marking nuclei is blue. In F and G, single color images showing BDC2.5 T cells in red are to the right of the overlaid image containing all four colors. White lines in the red single color image outline the islet body containing the insulin-producing cells. Select BDC2.5 T cells in the low-transfer model are marked with a yellow arrow to aid in visualization of the cells. Scale bar = 200 μm. PancLN, pancreatic LN. *Significant, P = 0.01–0.05. ***Extremely significant, P < 0.001.

