FIG. 4.
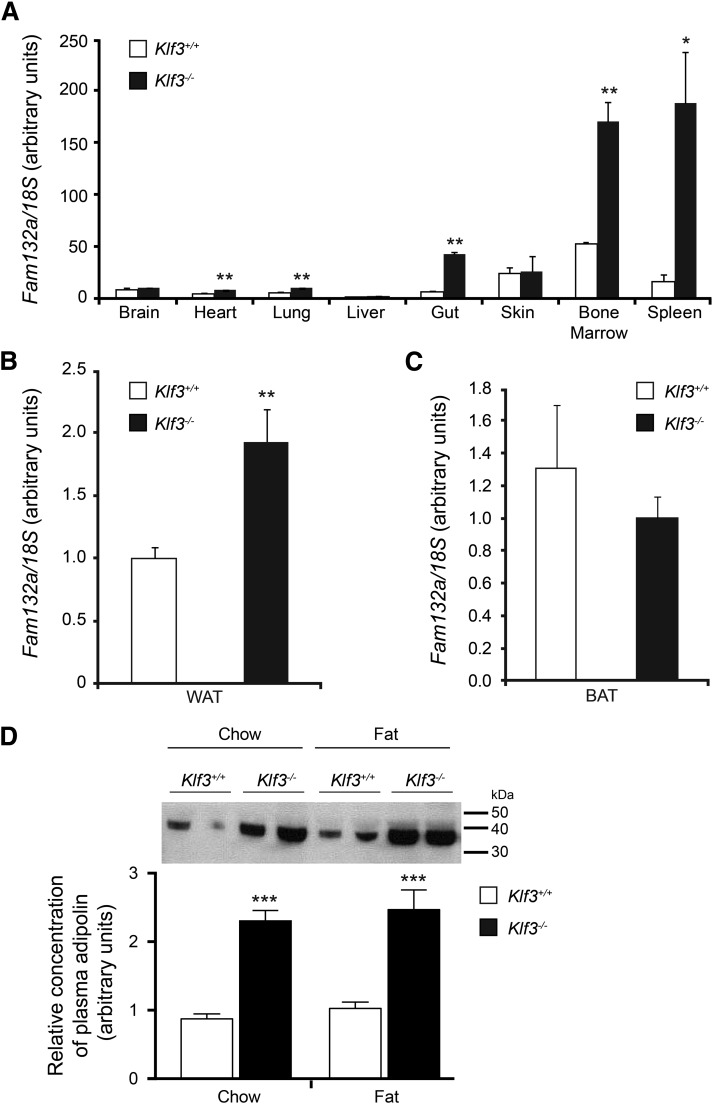
Fam132a gene expression and adipolin protein levels are increased in selected tissues in Klf3−/− mice. A: Fam132a mRNA expression in various tissues, as determined by real-time quantitative PCR (n = 3 for each genotype). B: Fam132a mRNA expression in epididymal WAT (n = 6 for each genotype). C: Fam132a mRNA expression in brown adipose tissue (n = 6 for each genotype). For panels A, B, and C, the relative expression of Fam132a mRNA was normalized against 18S rRNA, and the expression level of the lowest sample was set to 1.0. Error bars represent SEM. P values indicate the statistical difference between means (Klf3+/+ vs. Klf3−/−): *P < 0.05, **P < 0.01 (two-tailed t test). D: Adipolin protein levels in plasma of Klf3+/+ and Klf3−/− mice. Equal aliquots of diluted total plasma (1:20 in PBS) were resolved by SDS-PAGE and Western blotted with an anti-adipolin antibody to determine the relative concentration of plasma adipolin. The positions of molecular weight standards in kDa are indicated on the right-hand side of the blot. ***P < 0.001, Klf3+/+ vs. Klf3−/− (n = 11–29). BAT, brown adipose tissue.

