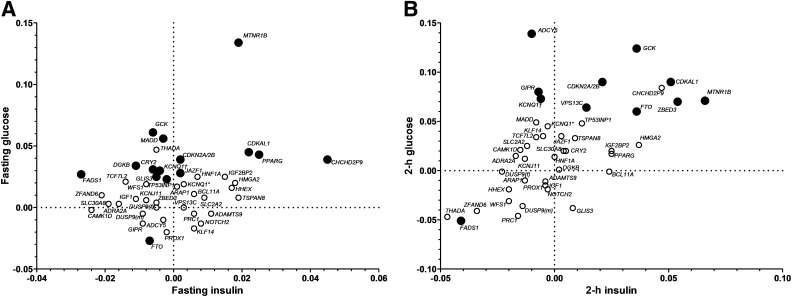
FIG. 2.
Graphic representation of effects of genetic variants on the relationship between glucose and insulin levels during OGTT in nondiabetic participants of the PPP-Botnia Study. Effect sizes are betas from linear regression adjusted for age, sex, and BMI. KCNQ1† represents rs2237895, and KCNQ1* represents rs231362. Black circles, P < 0.05; white circles, P > 0.05. A: The relationship between fasting insulin and fasting glucose. MTNR1B showed the highest effect on fasting glucose despite elevated insulin levels. CHCHD2P9 showed increased whereas FADS1 showed decreased fasting insulin. B: The relationship between 2-h insulin and 2-h glucose. GCK, CDKAL1, ZBED3, and MTNR1B all showed high postprandial glucose levels despite elevated insulin levels.

