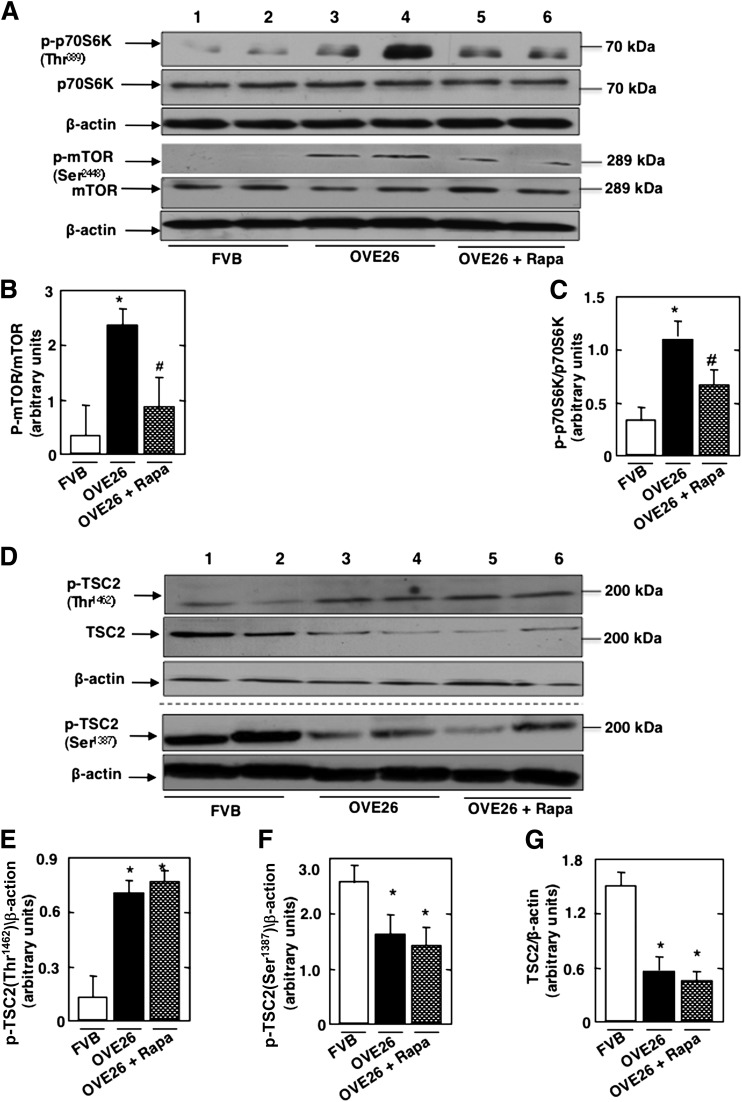
FIG. 4.
mTOR/p70S6K is activated in type 1 diabetes. OVE26 mice (17 weeks old) were treated with rapamycin (Rapa) (0.5 mg/kg body weight) for 5 weeks (3 times/week). Mice in the control group received saline vehicle. Glomeruli were isolated from the kidneys of three groups of mice (n = 5): FVB control mice, OVE26 mice, and OVE26 mice treated with rapamycin. A: Representative Western blot of p-p70S6KThr389, p70S6K, p-mTORSer2448, mTOR, and β-actin levels. Histograms showing quantitation of results for p-mTOR/mTOR (B) and p-p70S6K/p70S6K (C) from five mice. D: Representative Western blot of p-TSC2Thr1462, p-TSC2Ser1387, TSC2, and β-actin levels. Histograms showing quantitation of results from p-TSC2Thr1462/β-actin (E), p-TSC2Ser1387/β-actin (F), and TSC2/β-actin (G) in five mice. Values are the means ± SE from five animals for each group. *P < 0.05 OVE26 mice vs. FVB mice; #P < 0.05 rapamycin-treated OVE26 mice vs. vehicle-treated OVE26 mice.

