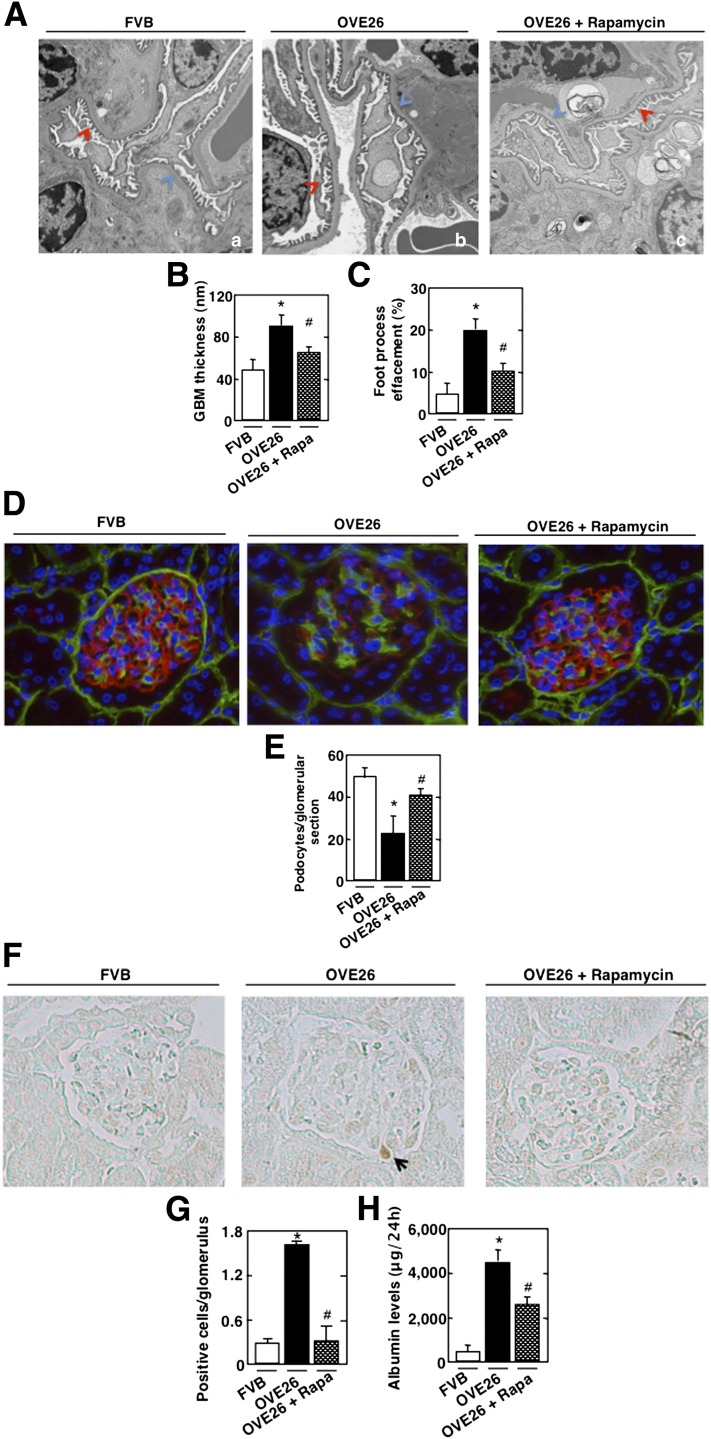
FIG. 7.
mTOR regulates GBM thickening, foot process effacement, podocyte loss/apoptosis, and albuminuria in type 1 diabetic mice. OVE26 mice (17 weeks old) were treated with rapamycin (Rapa) (0.5 mg/kg body weight) 3 times/week for 5 weeks. Mice in the control group received saline vehicle. Glomeruli were isolated from the kidneys of FVB control mice, OVE26 mice, and OVE26 mice treated with rapamycin (n = 5 mice/group). A: Representative transmission electron photomicrographs of glomerular cross-section of FVB, OVE26, and OVE26 mice treated with rapamycin. The images show foot process effacement (panel b, red arrow) and GBM (panel b, blue arrow) of an OVE26 mouse. This effect was not seen in the OVE26 mice treated with rapamycin (panel c). Histograms representing thickness of the GBM measured in nmol/L (B) and semi-quantitative analysis of foot process effacement of glomeruli (C) from each group of animals. D: Representative immunofluorescence images of glomeruli stained with collagen IV (green), synaptopodin (red), and 4′,6-diamidino-2-phenylindole (blue). E: Histogram representing podocyte number per glomerular section. Kidney sections of FVB, OVE26, and OVE26 mice treated with rapamycin stained by TUNEL (F) and total number of TUNEL-positive cells (G). H: FVB, OVE26, and OVE 26 mice treated with rapamycin were placed in metabolic cages for 24 h, urine was collected, and albumin levels were measured. Values are the means ± SE. *P < 0.05 OVE26 mice vs. control FVB mice; #P < 0.05 decrease in albumin levels in rapamycin-pretreated OVE26 mice vs. nontreated OVE26 mice (n = 5 per group).

