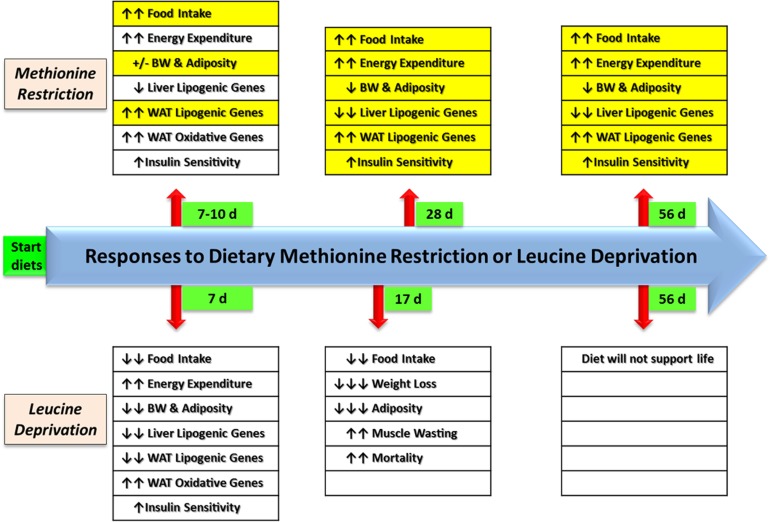
FIG. 2.
Responses of male C57BL/6J mice to dietary MR vs. dietary leucine deprivation at comparable time points after introduction of the respective diets. Data on MR is from ref. 8 and unpublished data. Data on leucine deprivation was compiled from refs. 9, 10, 30, 39, and 58. BW, body weight; d, days.

