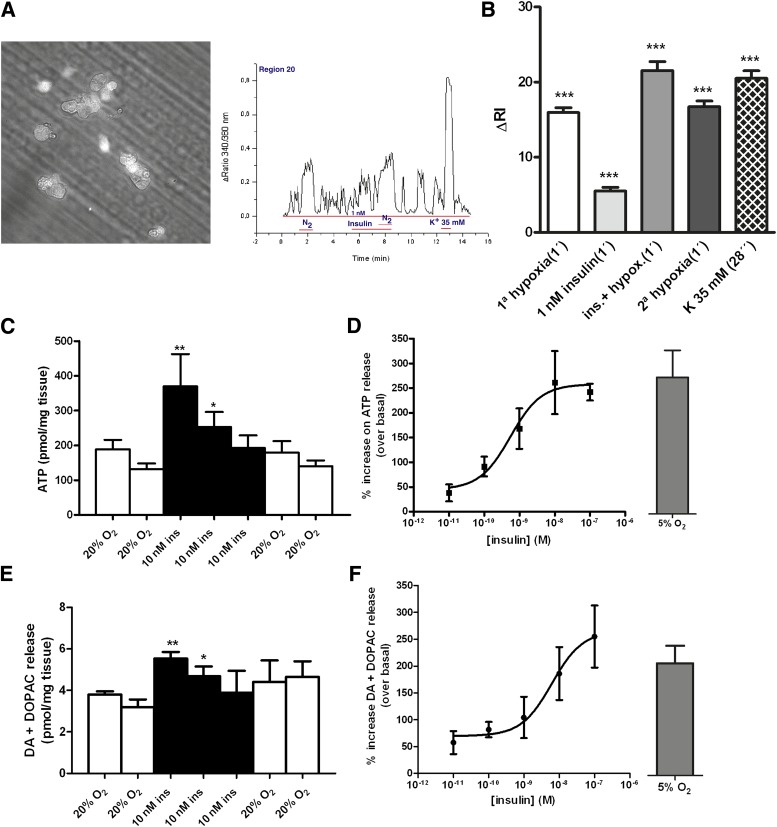
FIG. 5.
Insulin increases the neurosecretory responses in the CBs. A: Microscope field of dissociated rat CB cell culture and the typical recording of intracellular cell Ca2+, measured as the ratio of the fluorescent emission at 340/380 nm of chemoreceptor cells in basal conditions, in response to hypoxia (N2), to 1 nmol/L insulin, and to 35 mmol/L K+. B: Effect of insulin on intracellular cell Ca2+, measured as means of the ΔRI in 179 chemoreceptor cells. In every cell, the fluorescence signal was integrated as a function of time (running integral [RI]). C and D: Time course for the release of ATP from CB in response to insulin (10 nmol/L) and dose-response curve for insulin action on ATP release and its comparison with the effect of hypoxia (5% O2 plus 5% CO2 balanced N2). Release protocol consisted of two incubations of CBs in normoxic solutions (20% O2 plus 5%CO2 balanced N2, 10 min), followed by insulin application during 30 min in normoxia and two final normoxic incubations. E and F: Group of experiments identical to C and D but measuring catecholamine (dopamine plus DOPAC) release from CB instead of ATP. ATP and catecholamine quantification in the CB are means of 4–6 data. Bars represent means ± SEM. One- and two-way ANOVA with Dunnett and Bonferroni multicomparison tests, respectively; *P < 0.05, **P < 0.01, *** P < 0.001 vs. control. Controls in the release experiments correspond to the period prior to insulin application. ins, insulin.

