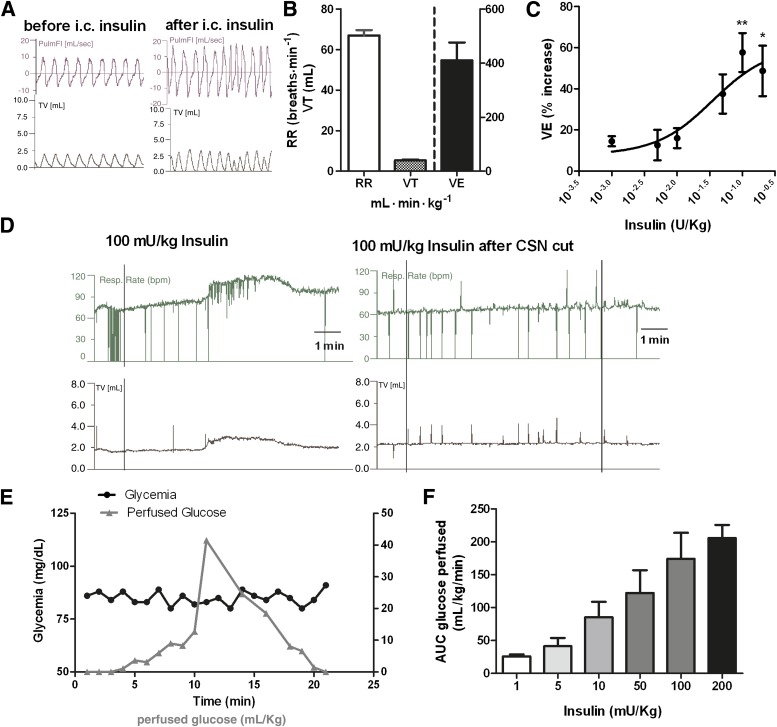
FIG. 6.
Insulin increases ventilation through a CB-mediated effect. A: Respiratory frequency and tidal volume (TV) recordings before and after administration of an intracarotid insulin (100 mg/kg) bolus. B: Mean basal ventilatory parameters, respiratory frequency (RR), tidal volume, and minute ventilation (VE) before insulin administration. C: Dose-response curve for the effect of insulin (1, 5, 10, 50, 100, and 200 mU/kg) on minute ventilation. For avoidance of the effect of hypoglycemia, the study of insulin effect on ventilation was performed in euglycemic conditions. Insulin effects on ventilation are means of 5–7 data. D: Typical respiratory frequency and tidal volume recordings due to the administration of an intracarotid insulin (100 mg/kg) bolus before and after CSN cut. E: Graph depicting a typical glucose perfusion curve to maintain euglycemia after insulin bolus and the levels of glycemia throughout the experiment. F: Total glucose concentrations perfused to maintain euglycemic clamp in response to the insulin concentrations (1, 5, 10, 50, 100, and 200 mU/kg) tested. Values represent means ± SEM. One-way ANOVA with Dunnett multicomparison test; *P < 0.05, **P < 0.01 vs. basal values. AUC, area under the curve; PulmFl, pulmonary flow.

