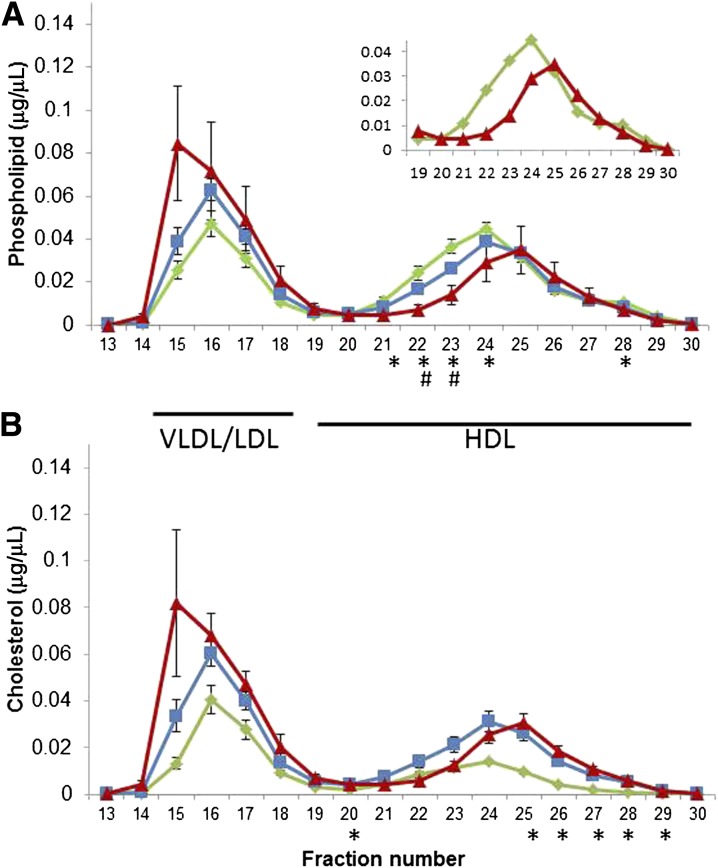
FIG. 1.
Lipid distribution profiles for all lean (green), obese (blue), and T2D (red) participants. Panel A displays the phospholipid content across the multiple size-based plasma fractions. Panel B displays the cholesterol content across the multiple size-based plasma fractions. Data are mean and SE. *P < 0.05 between lean and T2D groups; #P < 0.05 between obese and T2D groups after corrections for multiple comparisons.

