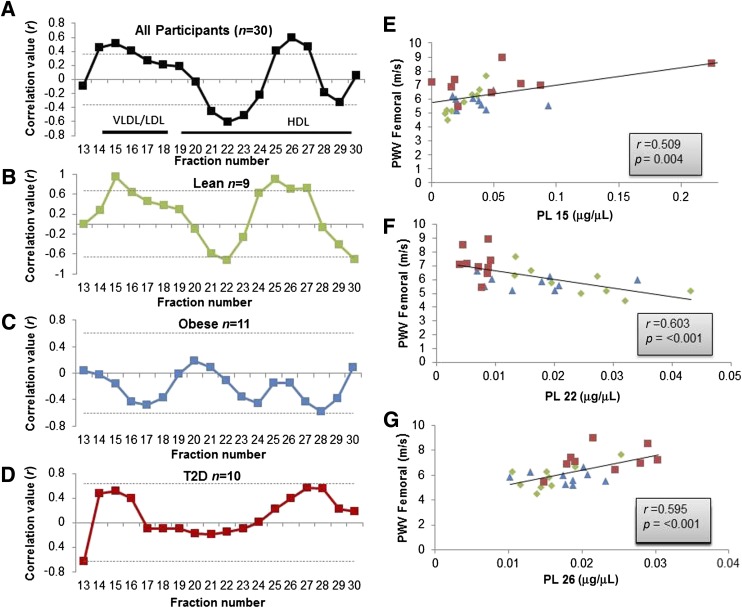
FIG. 3.
Correlations of phospholipid fractions with PWV. A displays the correlation value (r) for all participants (black), B for lean (green), C for obese (blue), and D for T2D (red). Outer dotted lines indicate r values of P < 0.05. Panels E–G display individual fractions with the strongest correlations with PWV: fraction 16 (E), fraction 22 (F), and fraction 26 (G).

