
FIG. 1.
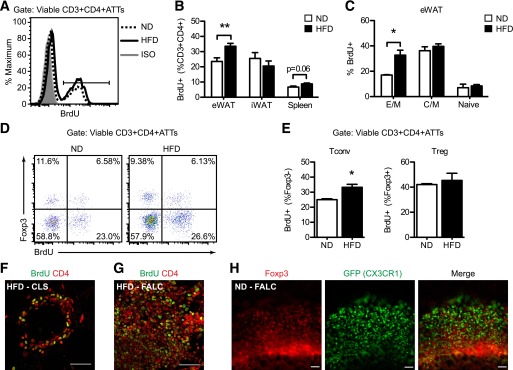
Adipose tissue CD4+ T-cell proliferation is induced in visceral fat in response to dietary obesity. Male C57BL/6 mice were fed ND or HFD (60% fat) for 14 to 17 weeks. BrdU was added to the drinking water for 5 consecutive days before splenocytes and adipose tissue stromal cells were isolated and analyzed by flow cytometry. A: Representative histogram shows BrdU incorporation in CD3+ CD4+ ATTs in eWAT from ND (dashedline) and HFD (solidline) mice. Isotype (ISO; shaded) is shown. B: Quantification of BrdU+ CD4+ T cells (expressed as percentage of viable CD3+ CD4+ lymphocytes) in eWAT, iWAT, and spleen from ND and HFD mice. Data are means ± SEM (ND eWAT: n = 5–6; HFD eWAT: n = 10; iWAT and spleen: n = 4 mice per group). C: Quantification of BrdU+ effector-memory (E/M; CD44High CD62L−), central-memory (C/M; CD44High CD62L+), and naïve (CD44Low CD62L+) CD4+ ATT subsets in eWAT from ND and HFD mice. Data are means ± SEM (ND: n = 3–4; HFD: n = 5–6 mice per group). D: Representative scatterplots (Foxp3 vs. BrdU) of viable CD3+ CD4+ ATTs demonstrating proliferation of conventional (Tconv, Foxp3−) and regulatory (Treg, Foxp3+) CD4+ T cells in eWAT from ND and HFD mice. E: Quantification of proliferating Tconvs and Tregs in eWAT from ND and HFD mice. Data are means ± SEM (ND: n = 3; HFD: n = 5 mice per group). BrdU+ (green) and CD4+ (red) lymphocytes were identified by confocal microscopy (original magnification ×60) in CLS (F) and FALC (G) within eWAT fat from HFD mice. Bar = 50 μm for F and G. H: Identification of Foxp3+ lymphocytes (red) in proximity to GFP+ ATMs (green) in FALCs in eWAT from a ND Cx3cr1GFP/+ reporter mouse. Scale bar = 100 μm. *P < 0.05, **P < 0.01 for ND vs. HFD.