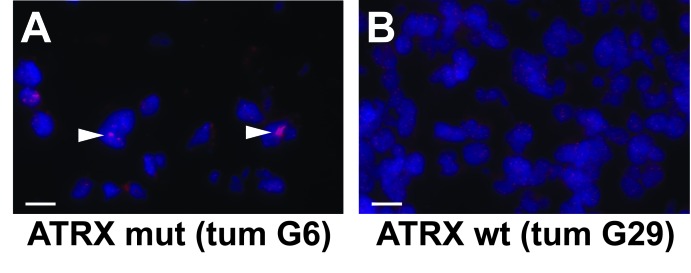
Figure 2. Telomere FISH demonstrates ALT in ATRX-mutant LGG.
Representative micrographs showing telomere FISH (red) performed in ATRX-mutant (mut; A) and wild type (wt; B) LGGs. An intranuclear ALT-positive focus is indicated (arrowhead). Slides were counterstained with DAPI (blue). White scale bars are 120 μm.

