
Figure 3. Dose response curves for GSCs treated with DSF.
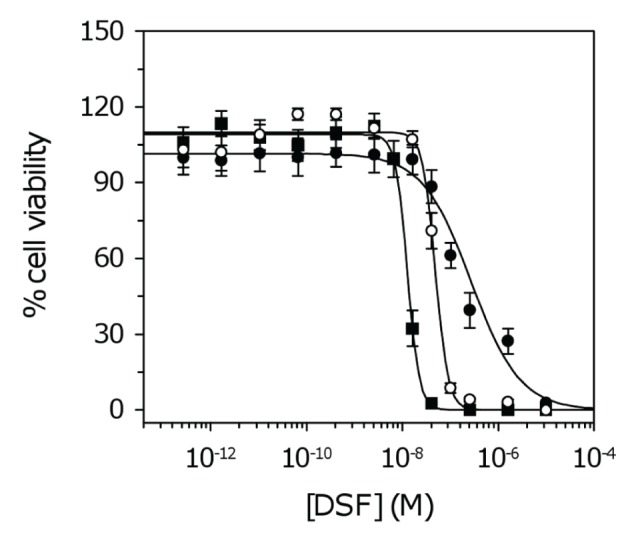
For clarity, three of ten cell lines are shown corresponding to NSCs and GSCs with the lowest and highest IC50. Data represent the mean and SD from four independent experiments. Data were fit to the standard sigmoidal dose response curve. Closed circles, NSCs; open circles, highest IC50 (SN195); closed squares, lowest IC50 (SN235) (Table S6).