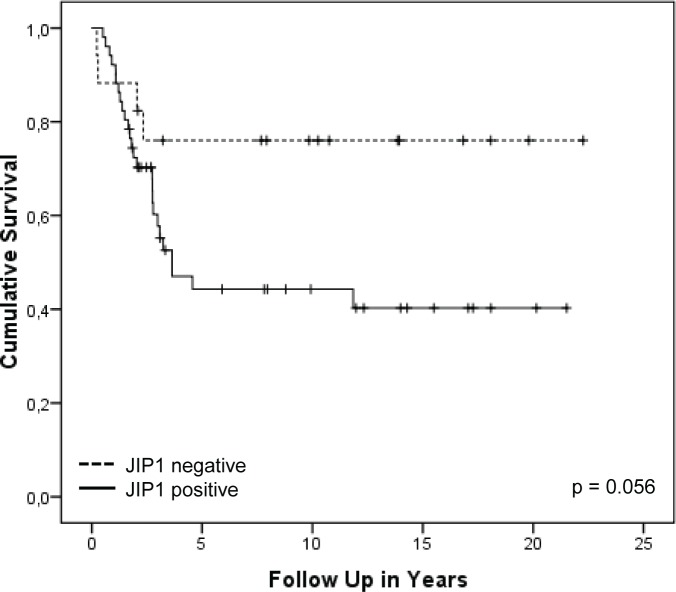
Figure 5. Kaplan-Meier overall survival analysis of OS patients with JIP1 positive or negative tumours.
Kaplan-Meier survival plot showing the cumulative survival of patients suffering from localised OS. Patients were divided into groups of patients with JIP1 positive tumours (55 samples) and those with JIP1 negative tumours (16 samples). The observed difference in cumulative survival between the two groups shows a trend towards inferior survival outcomes for patients with positive JIP1 staining (p = 0.056).

