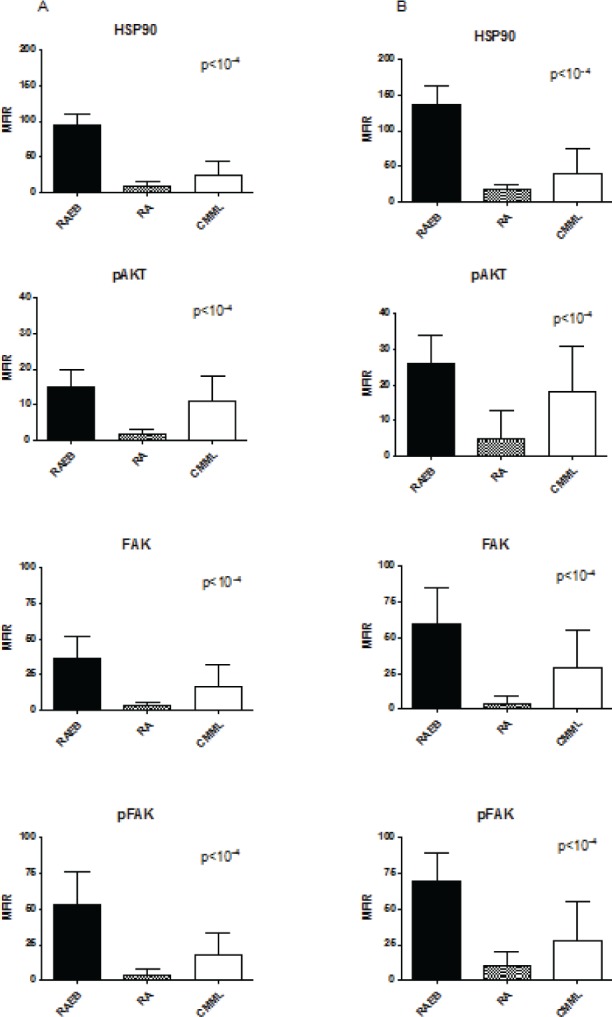
Figure 1. Level of HSP90, pAKT, FAK and pFAK expression according to MDS subgroups.

The mean fluorescence intensity ratio (MFIR) for each protein in bone marrow MNC (A) or CD34+ cells (B) was evaluated in high risk MDS patients (RAEB, n=93) versus low risk MDS patients (RA, comprising the RAUD, RARS, RCMD, RCMD-RS and 5q- subgroups, n=61), and CMML patients (n=23).
