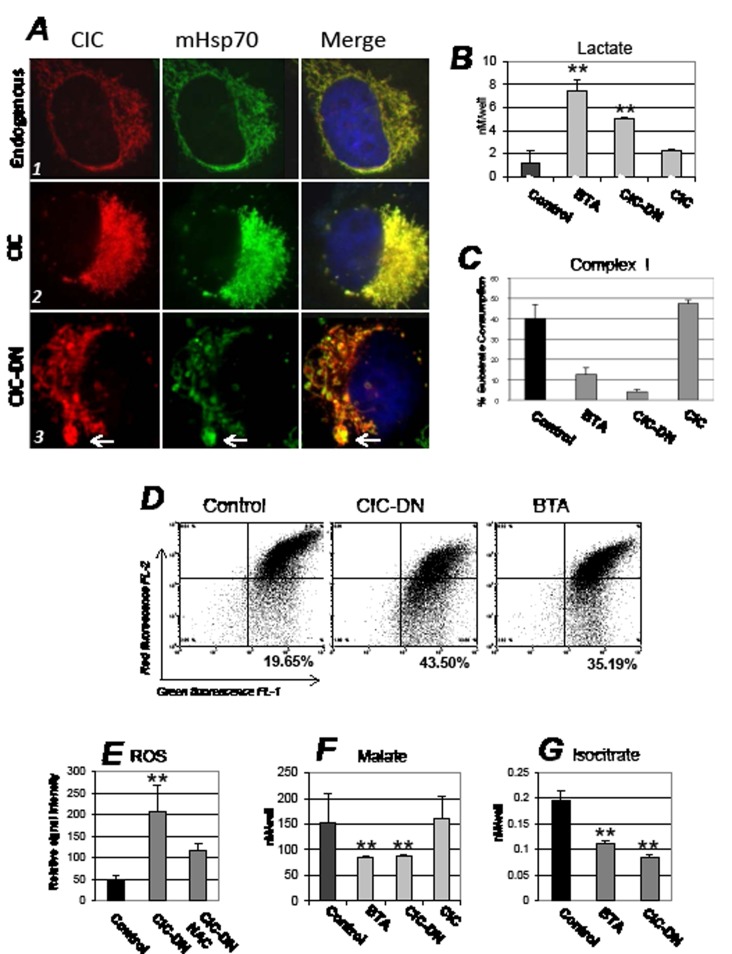
Figure 4. Mitochondrial and metabolic effects arising from CIC inhibition.
A. H1299 cells (panel set indicated as 1), or cells expressing CIC (2) or CIC-DN (3) were stained with anti-CIC (red) or anti-mitochondrial Hsp70 (mHsp70, green) antibodies, and counterstained with DAPI. The DAPI signal is shown only in the merged images. For these experiments cells were harvested 46 hours after tetracycline induction. The arrow in panel A3 indicates mitochondria with enlarged and abnormal morphology (mega-mitochondria). The next set of panels shows measurements of lactate levels (B), of complex I- (C); of mitochondrial membrane potential assessed with a JC1 assay (MMP) (D); of ROS (E); of malate (F); and of isocitrate (G) levels. Measurements were performed in cells treated with DMSO (indicated as control), or with BTA, or expressing CIC or CIC-DN at 16 hours after treatment or tetracycline induction, respectively. In the case of ROS levels, panel D shows a dot plot or red (FL-2) versus green fluorescence (FL-1) of JC1 staining. In mitochondria with intact membrane potential the JC1 dye concentrates into red fluorescent aggregates, while depolarized mitochondria are unable to concentrate the JC1 and exhibit green fluorescence. The percentage of cells with depolarized mitochondrial membrane is shown in bold at the bottom of each panel.

