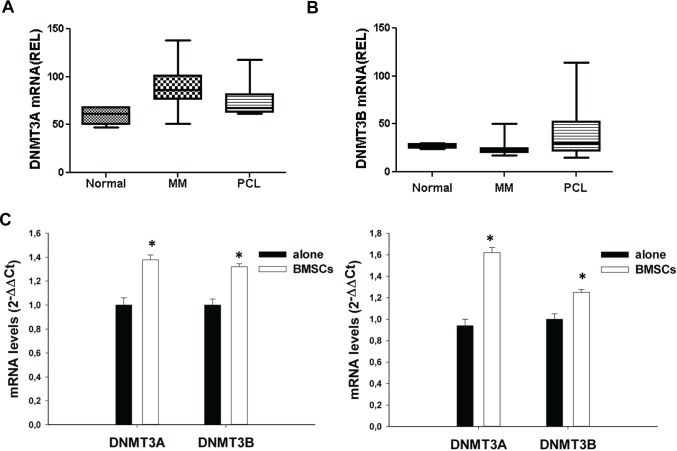
Figure 1. Expression of DNMT3A and DNMT3B in MM and PCL patients or in MM cell lines.
Differential expression of DNMT3A (A) and DNMT3B (B) in controls, MM and PCL patients. DNMT3A and DNMT3B mRNA levels were obtained by cDNA microarray and reported as raw expression values. The statistical significance of differences among the groups was assessed using Kruskal-Wallis test (P=0,0018 for DNMT3A; P=0,05 for DNMT3B). (C). Quantitative RT-PCR of DNMT3A or DNMT3B in KMS12 (left panel) and NCI-H929 (right panel) cells co-cultured with MM patient-derived BMSCs and then immunopurified by immunomagnetic sorting with anti-CD138 beads. Raw Ct values were normalized to GAPDH and expressed as ΔΔCt values calculated using the comparative cross threshold method. DNMT3A or DNMT3B levels in cells cultured in absence of BMSCs were set as internal reference. Data are the average of two independent co-culture experiments performed in triplicate. P values were obtained using two-tailed t test. * P<0,01.

