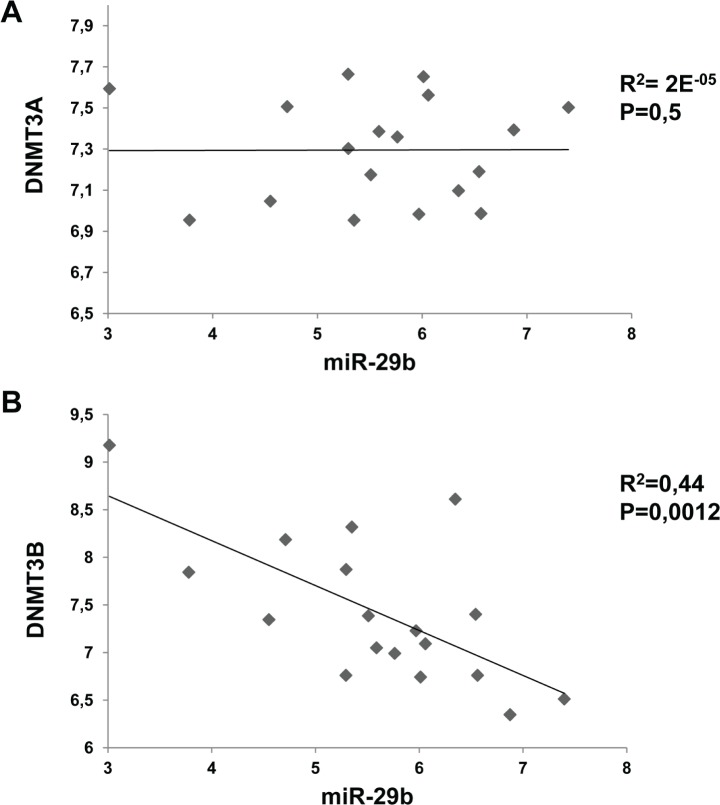
Figure 3. Inverse correlation between miR-29b and DNMT3B levels in MM cell lines.
Correlation of endogenous miR-29b levels with DNMT3A (A) and DNMT3B (B) mRNA levels determined by high density microarray of mRNA and miRNA expression in a panel of 17 MM cell lines. Log values of raw data are reported in graph. R= regression coefficient.

