
Fig 2.
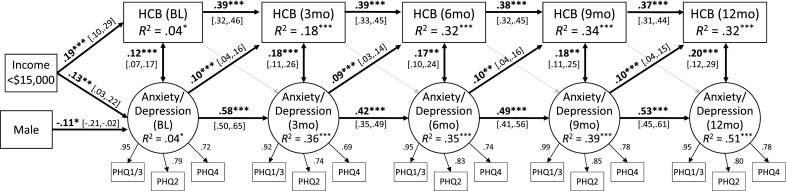
Cross-lagged model showing associations between health compromising behaviors and stress over 1 year. The four items from the Perceived Stress Scale serve as indicators for the latent stress construct; items 1 and 2 were averaged at each time point to create the first indicator. Standardized regression coefficients are reported. Control variables included sex, race, income, and age. Factor loadings, autoregressive paths, lagged paths, and within-time correlations between variables were constrained to be equal over time, although standardized values differ slightly. Long-term (6-month) autoregressive effects for HCBs and stress were also included in the model. Gray arrows represent nonsignificant paths. Average fit indices across 100 multiply imputed datasets: χ2(245) = 301.47, p < 0.01, CFI = 0.96, TLI = 0.95, RMSEA = 0.02. *p < 0.05; ***p < 0.01. HCB health-compromising behaviors, BL baseline, 3mo 3 months after baseline, 6mo 6 months, 9mo 9 months, 12mo 12 months