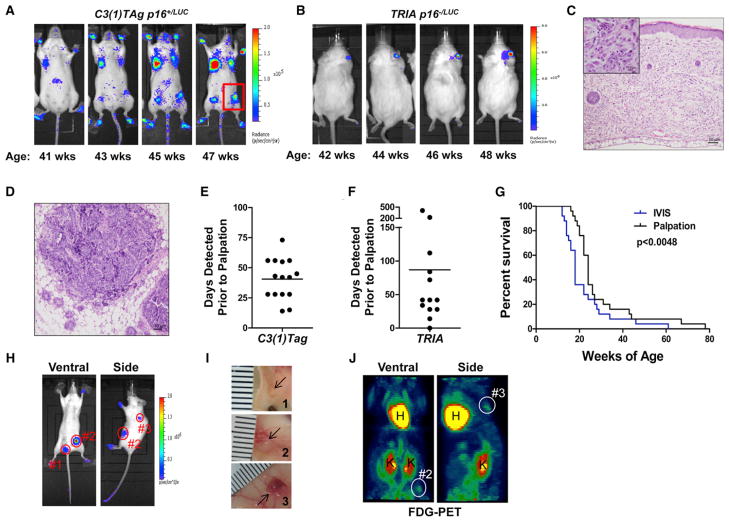
Figure 3. p16LUC Marks Early, De Novo Tumorigenesis.
(A) Representative serial images showing p16LUC accumulation at p16+/LUC, C3(1)TAg+ tumor foci during a period of 8 weeks. Several focal, mammary, and paw tumors are visible. A palpable tumor, smaller than could be measured by calipers, is highlighted in the red box.
(B) Representative serial images showing p16LUC accumulation at a p16−/LUC TRIA ear tumor during a period of 6 weeks.
(C) Haematoxylin and eosin staining showing the morphology of the TRIA ear tumor shown in (B).
(D) Haematoxylin and eosin staining showing the morphology of the barely palpable C3(1)TAg tumor highlighted in (A).
(E) The number of days prior to palpation or visualization where luciferase activity was observed in tumors of p16+/LUC C3(1)TAg mice. Data are shown for individual tumors with the median detection advantage indicated by a line.
(F) The number of days prior to palpation or visualization where luciferase activity was observed in tumors from p16−/LUC TRIA mice. Data are depicted as in (E).
(G) Combined Kaplan-Meier analysis of tumor-free survival in p16+/LUC C3(1)TAg and p16−/LUC TRIA mice by using tumor detection by either luminescence or palpation. Significance was determined by using a log rank test.
(H) Luciferase images of a p16+/LUC C3(1)TAg mouse with early mammary tumors (2 min ventral image, 1 min side image).
(I) Photographic images of mammary tumors dissected from the mouse in (H) and (J). Ruler hash marks represent 1 mm units.
(J) FDG-PET images of the same p16+/LUC C3(1)TAg mouse shown in (H). Tumor 1 is not visualized by FDG-PET.
See additional supporting data in Figure S3.

