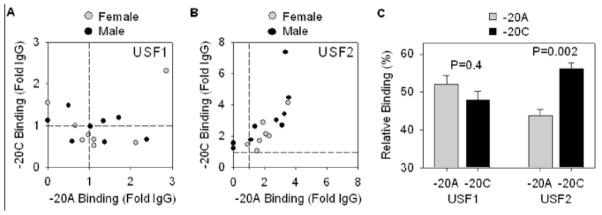
Figure 6. Binding of USF1 and USF2 to −20 chromatin.

A–B. ChIP analysis was used to measure the enrichment of USF1 and USF2 vs IgG in the chromatin precipitate with antisera targeting each transcription factor. The relative binding was determined by quantitative PCR using allele-specific probes and standard curves similar to those shown in Figure 3B. The background of the assay, that is where the ChIP signal equals the IgG control, is indicated by the dashed line. C. Quantification of the relative percentage of USF1 and USF2 binding to −20A vs −20C chromatin. Significance was determined by paired t-test comparing −20A vs −20C. All data presented as mean ± SEM.
