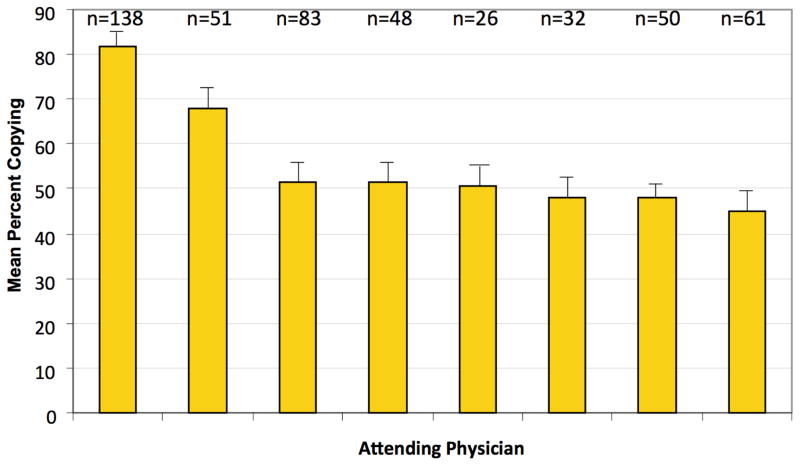
Figure 3. Adjusted mean percent copying by attending.
Bars represent adjusted mean levels with standard error bars. The number of patients evaluated by each physician is listed above each bar. Three attending physicians with a small number of observations not displayed. Overall effect of attendings (p<0.001); pairwise differences between the first attending and all other attendings was significant (p<0.05); pairwise differences between attending two and all other attendings was significant (p<0.05); pairwise differences between the third and last attendings was significant (p<0.05).

