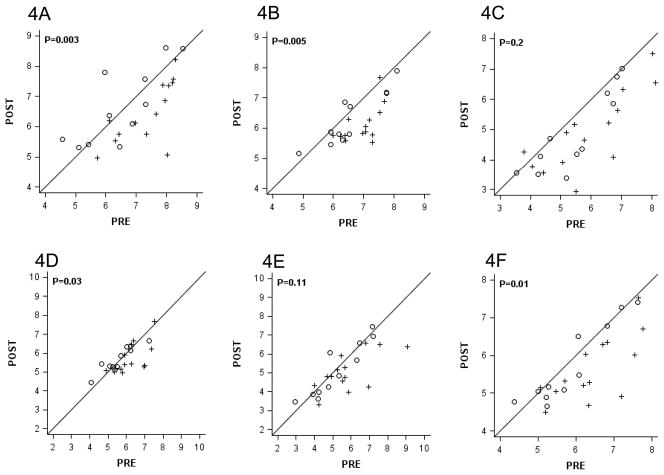
Figure 3.
Pre- and Post- Vorinostat Values of Proliferation-Associated Gene Expression using the Oncotype DX® 21-gene assay.
Vorinostat-Treated Women (+, N=14) versus Control (○, N=11) for Ki-67 (A), STK15 (B), MYBL2 (C), Cyclin B1 (D), Survivin (E), and the Proliferation Axis (F). Values are on a log2 scale. Exact two-sided p-values are based upon the 2-sample Wilcoxon rank-sum test.

