
Figure 2. Power of length and joint tests corresponds to the behavior predicted by geometric framework.
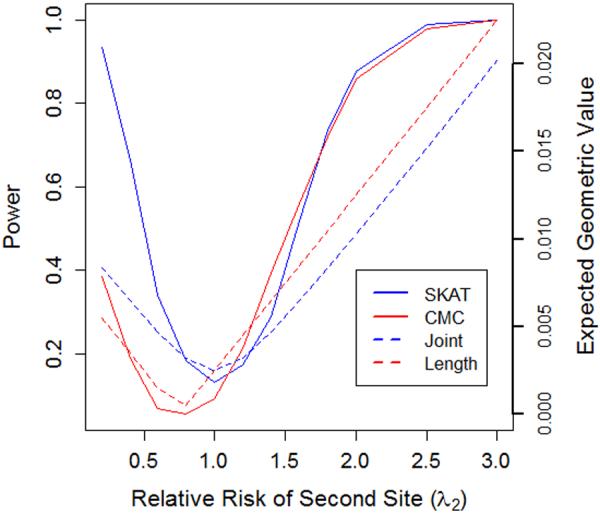
This graph illustrates the power of length and joint tests in relation to the expected value of the difference in lengths or length of difference of F+ and F−. In particular we consider the simplified scenario of a gene containing two rare variants, both with an allele frequency of 1%. The sample consists of 1500 cases and 1500 controls. The relative risk at the first variant site (λ1) is fixed at 1.25, while the relative risk at the second site (λ2) varies along the x-axis.
We plot the power of power of a length test (CMC) alongside the expected value of | ∥f+∥2 − ∥f−∥2|. The expected value of the length test statistic will be minimized (taking a value of zero) when the relative risk at site two is 0.75. As the relative risk at site two (λ2) moves away from the value 0.75, the expected value of the length test statistic increases linearly. A similar pattern of behavior is observed for other length tests (e.g., CMAT and PR) though not shown here. We also plot the expected value of ∥f+ − f−∥2 along with the power of a joint test (SKAT) Unlike length tests, joint tests attain their minimum value when λ2=1, with the value of the expected value of both statistics increasing symmetrically as λ2 moves away from 1. A similar pattern of behavior is observed for other joint tests (e.g., C-alpha), though not shown here.