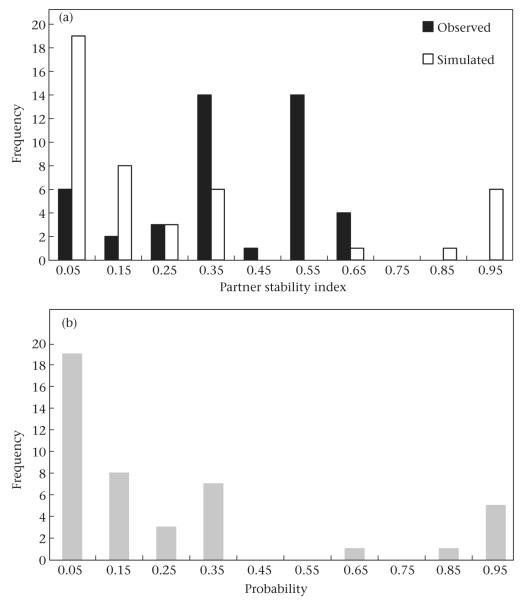
Figure 4.
Partner stability index (PSI) for adult female baboons in the Moremi study group. (a) Distribution of observed and simulated PSI values. (b) Distribution of probability levels associated with observed PSI values. The distribution of simulated PSI values is shifted further to the left than the distribution of observed PSI values, which indicates that females’ relationships with their top partners were generally more stable than expected by chance.

