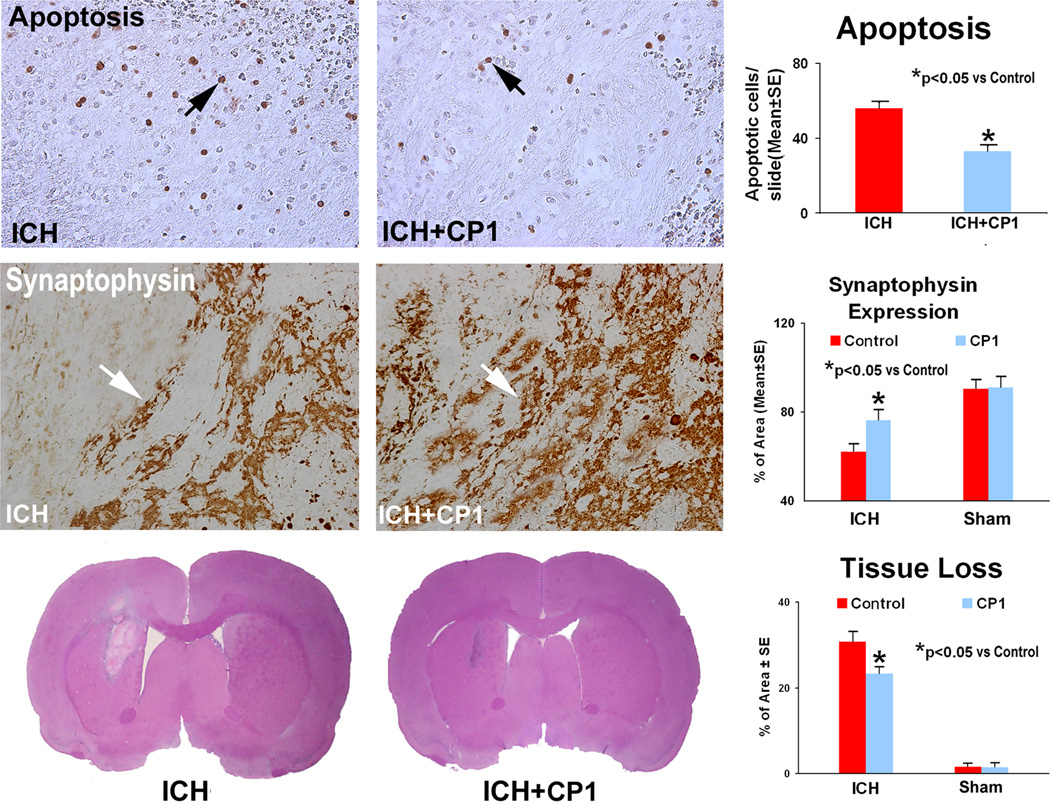
Fig. 2.
Immunostaining of the control and treatment sections showing the quantitative immunoreactivities of BrdU and TUJ1. Quantitative immunoreactivities for both groups are presented as bar graphs on the right side of each panel. Colocalization of BrdU and TUJ1 in a subpopulation of cells near the injured region of the combination group is shown on the upper panel. Arrows indicate cells positively stained for both BrdU and TUJ1.

