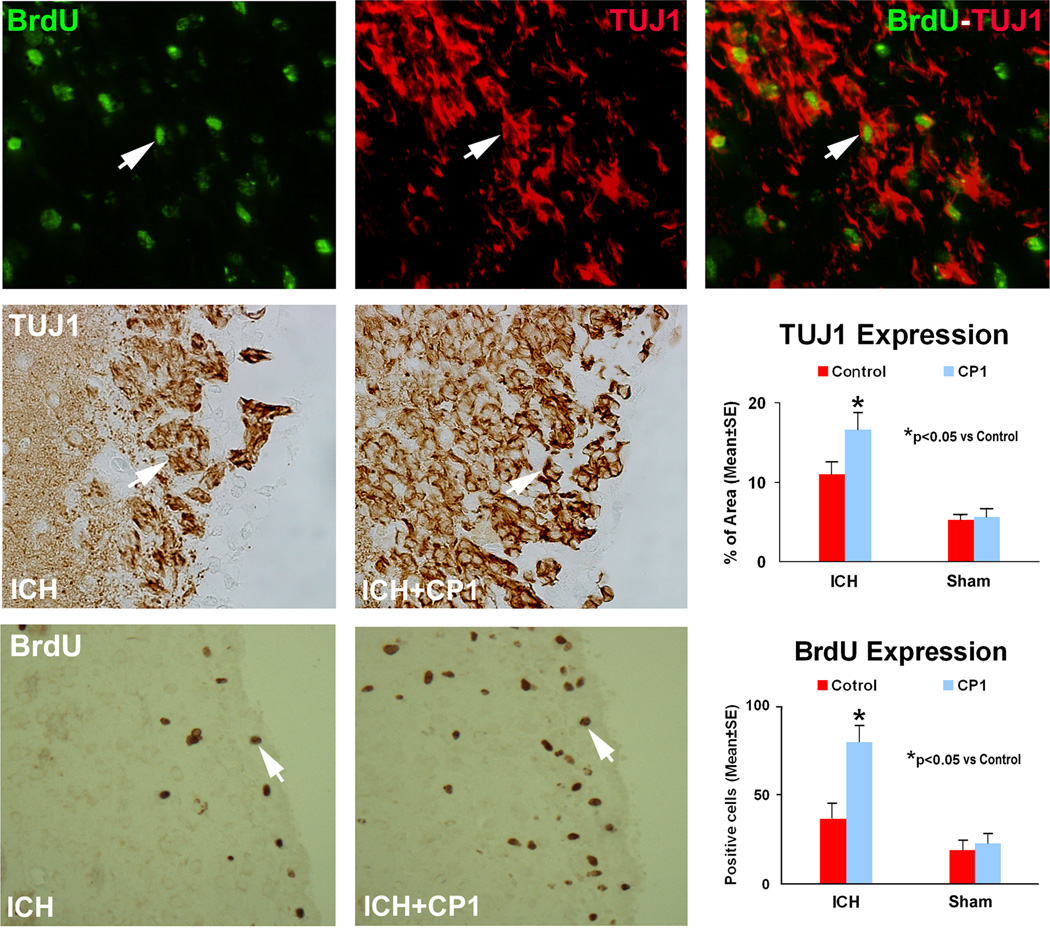
Fig. 3.
Representative immunostaining and quantitative immunoreactivities of VWF and BrdU in the ipsilateral hemisphere at 2 weeks after ICH. Upper panels show BrdU (left) and VWF (center) immunostaining and colocalization of BrdU-VWF (right) for a subpopulation of cells located near the injured site for a CP-1-treated animal. Arrows indicate cells that stained positively for both BrdU and VWF. VWF results are shown in the lower panels for control (left) and CP-1 (center) treatment groups, respectively. Quantitative immunoreactivities for both groups are presented as bar graphs in the lower right panel.

