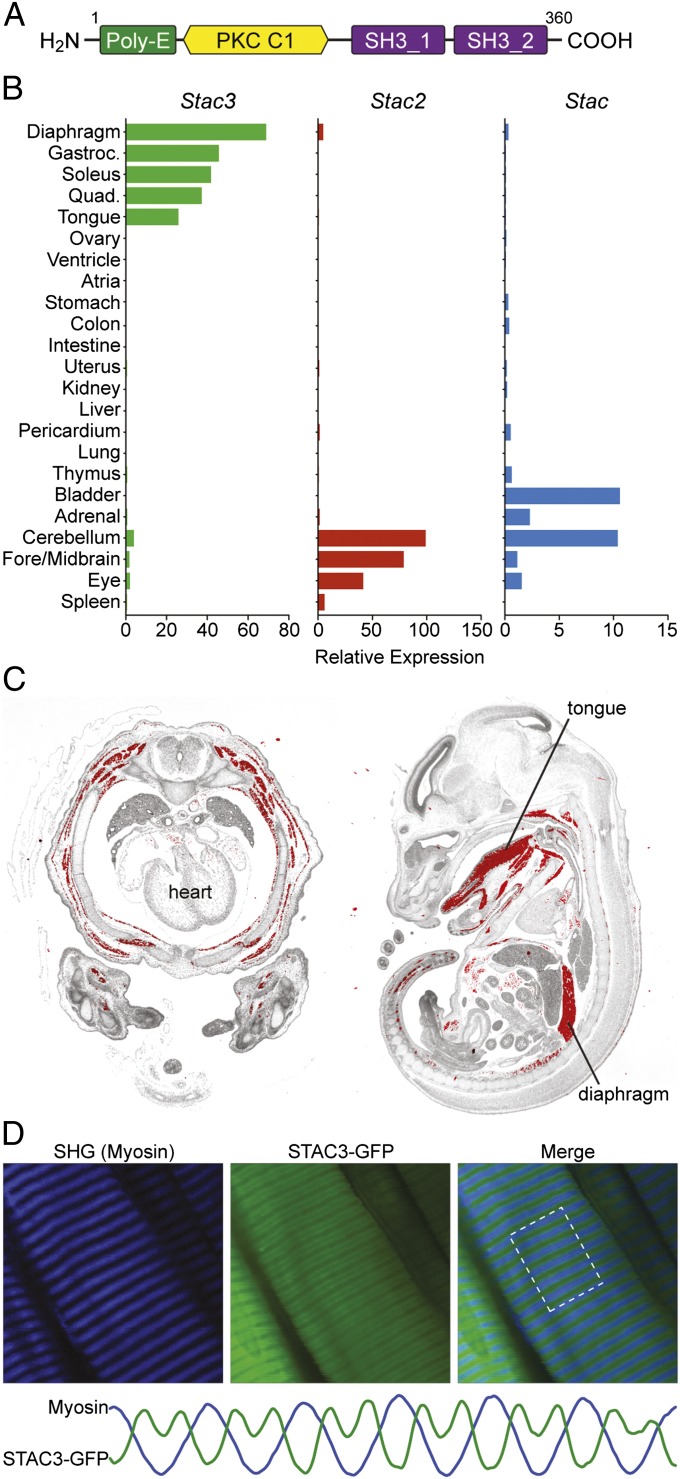
Fig. 1.
Domain structure and expression of Stac3. (A) The domain architecture of STAC3 consists of a region containing 11 consecutive glutamic acid residues (Poly-E), a protein kinase C (PKC) C1 domain, and two SH3 protein-interaction domains. Scales of each domain are not directly proportional. (B) Expression profiles of Stac, Stac2, and Stac3 determined by real-time PCR in adult mouse tissues. (C) In situ hybridization of an E14.5 mouse transverse thorax (Left) and an E15.5 sagittal section (Right) shows skeletal muscle-specific expression of Stac3. Hybridization signal is pseudocolored red. (D) T-tubule localization of STAC3. Flexor digitorum brevis muscles were electroporated in vivo with a Stac3 C-terminal GFP fusion construct, and the live muscle was imaged after a 3-d recovery period. The fusion protein localized in a repeating doublet pattern alternating with the myosin A bands, as visualized by second harmonic generation (SHG). This pattern is consistent with localization to T tubules. The plots for each channel, shown at the bottom, were generated using the ImageJ Plot Profiler tool within the highlighted region. The scales of these plots were arbitrarily adjusted to compare the patterns.

