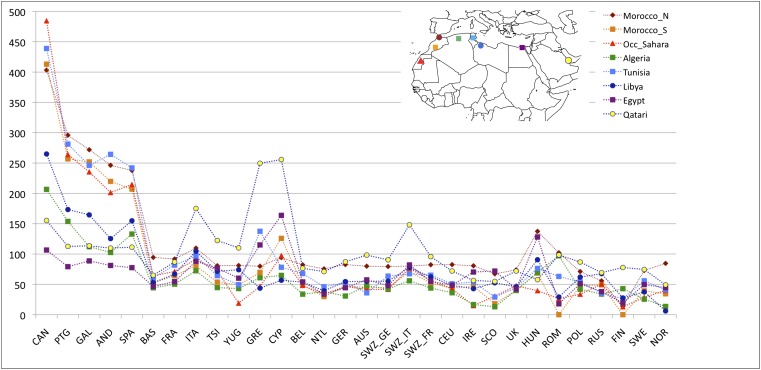
Fig. 3.
Population-specific estimates of haplotype sharing (in centimorgans) between North Africa and Europe. Estimates of WEA (scaled by 100 for ease of presentation) between each European population (x axis) and each North African population and the Qatari are represented by colors and symbols. A substantial increase in haplotype sharing is detected between southwestern European populations and Maghrebi populations in comparison with the remainder of the European continent. The excess of sharing between the Near East and southern central and Eastern Europe is also noteworthy.

