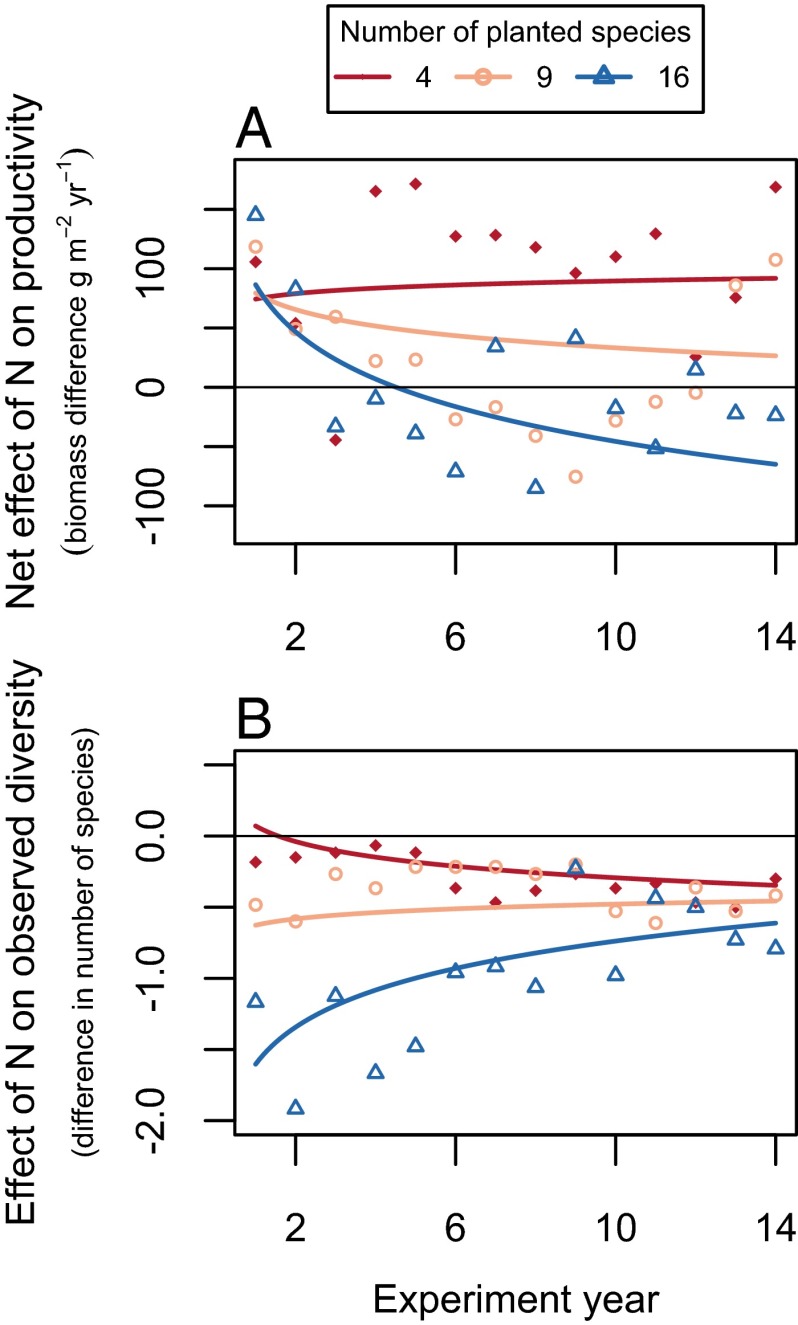
Fig. 3.
(A and B) BioCON plots planted with the most grassland plant species exhibited the largest declines in the net effect of N enrichment on productivity (N × Year × Diversity: F1, 2056 = 20.52, P < 0.0001; Table S1) (A), and the largest negative effects of N enrichment on observed diversity (N × Year × Diversity: F1, 2056 = 7.79, P = 0.0053; Table S1) (B). Linear mixed effects models were used to estimate effects (Table S1). Differences in biomass (A) or number of species (B) were quantified between enriched and ambient plots, with positive biomass differences indicating that enriched plots were more productive, and with negative species differences indicating that enriched plots had fewer species, than ambient plots.

