
Fig. 2.

Comparison of exact integration of the master equation (solid lines) vs. the Landau approximation (dashed lines) and the distribution represented by the Lea–Coulson generating function in Eq. 21 (dots) for  ,
, 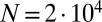 and
and  , and
, and  .
.
Official websites use .gov
A
.gov website belongs to an official
government organization in the United States.
Secure .gov websites use HTTPS
A lock (
) or https:// means you've safely
connected to the .gov website. Share sensitive
information only on official, secure websites.
Comparison of exact integration of the master equation (solid lines) vs. the Landau approximation (dashed lines) and the distribution represented by the Lea–Coulson generating function in Eq. 21 (dots) for , and , and .