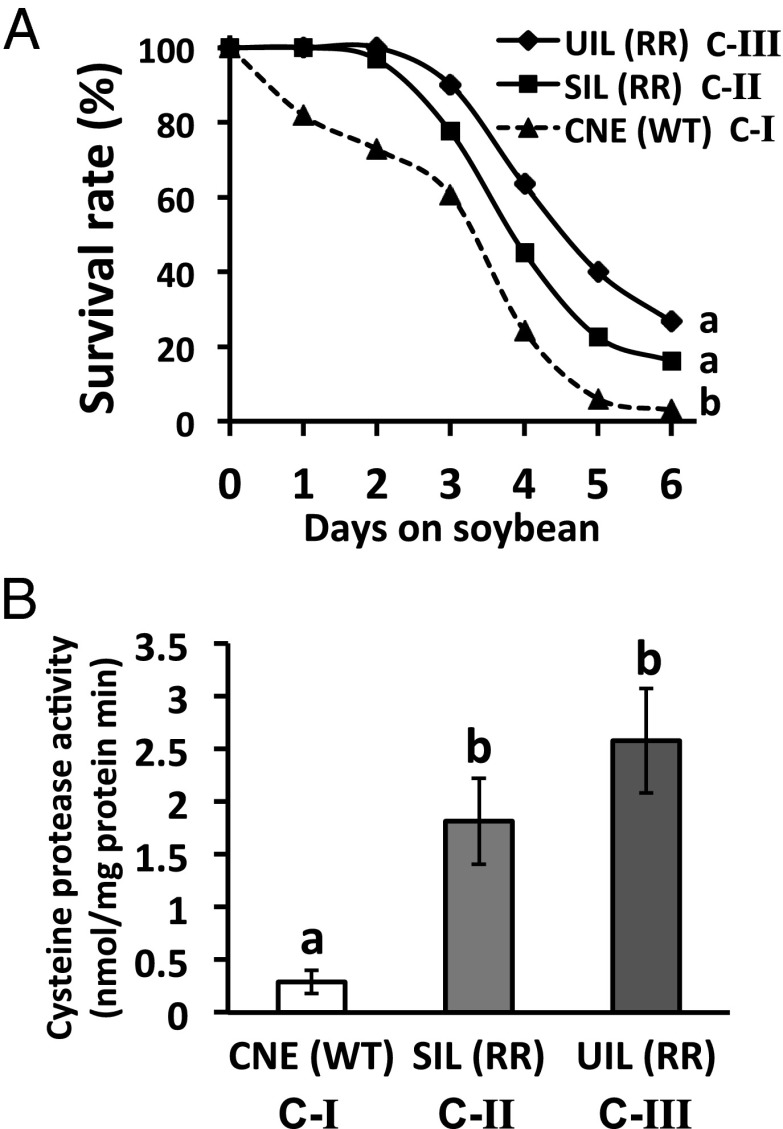
Fig. 3.
(A) Survival of WCR populations representative of each microbiota cluster (in Fig 2C, C-I–C-III) on soybean. Survival of WCR is illustrated by the proportional change in surviving insects over time. Significant differences (log-rank test) between survival curves are declared at P < 0.05 (letters next to curves). (B) Gut cysteine protease activity while on corn diets. Activity is expressed as nanomoles of pNA released per milligram of gut protein per minute. Different letters above bars indicate significant difference in activity levels [Fisher’s Least Significant Difference (LSD), P < 0.05].

