Fig. 1.
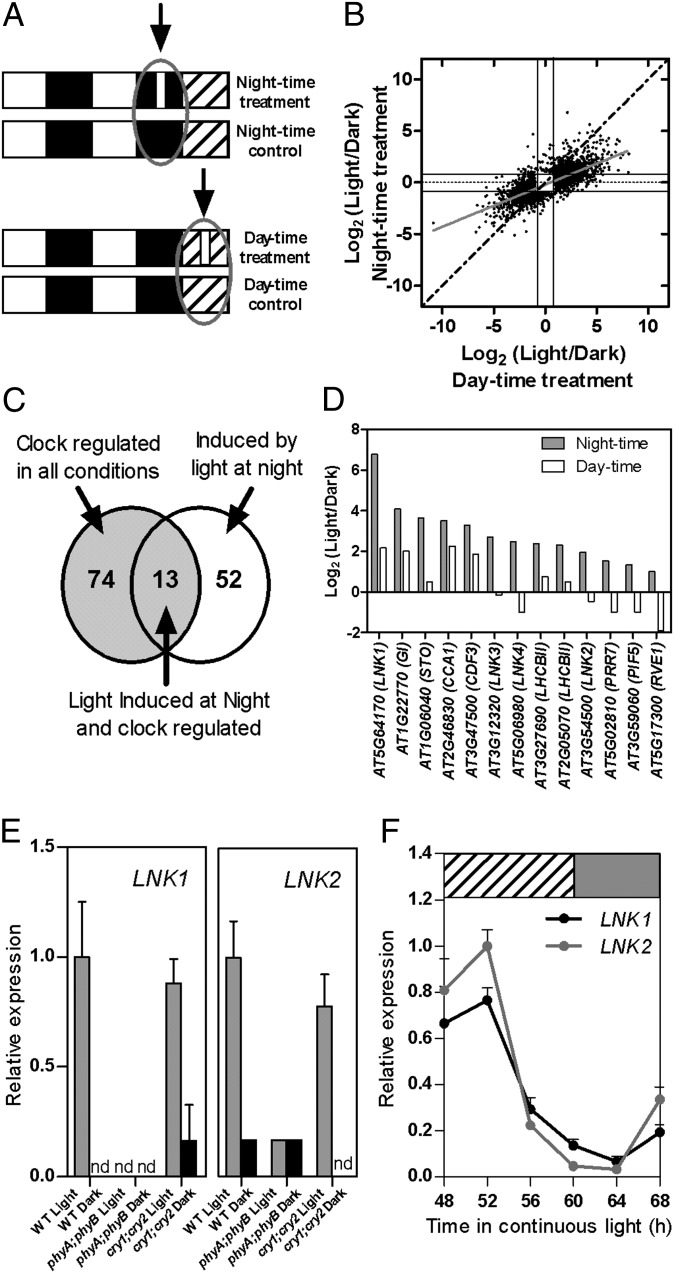
Genomewide analysis of light and clock interactions in the control of gene expression and identification of LNK genes. (A) Experimental design. Plants were grown under 12-h light/12-h dark cycles for 14 d and then exposed or not to a 1-h light pulse in the middle of the night or subjective day on the 15th day. (B) Comparative genomewide expression analysis of the effect of a light pulse given during subjective day time (x axis) vs. night time (y axis). (C) Overlap between 87 genes that are rhythmically expressed under multiple conditions (23) and 65 genes that showed a stronger induction by light during night time compared with subjective day time (Dataset S1). (D) Microarray data corresponding to the relative response of LNK genes to a 1-h light treatment given in the middle of the night or subjective day. (E) Relative expression levels of LNK1 and LNK2 measured by qRT-PCR. The analysis was conducted in WT, phyA;phyB, and cry;cry2 plants grown under 12-h light/12-h dark cycles and exposed or not to a 1-h light pulse in the middle of the night (n = 3). nd, not detectable. Data represent average + SEM. (F) Circadian expression of LNK1 and LNK2 genes. Expression was determined by qRT-PCR during the third day under free running conditions. n = 4. Data are average + SEM. White, dark, gray, and hatched boxes indicate day, night, subjective night, and subjective day, respectively.

