Fig. 2.

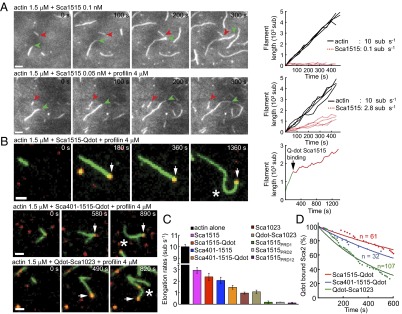
Actin filament elongation by Sca2. (A) Polymerization of 1.5 μM ATP-actin in the presence of 0.1 nM Sca1515 (Upper) or 0.05 nM Sca1515 and 4 μM profilin (Lower). Green and red arrowheads point to the barbed ends of actin filaments growing on their own or associated with Sca1515, respectively. (Scale bars, 2 μm.) The plots on the right illustrate the growth of individual actin filaments alone (black) or associated with Sca1515 (red dashed) versus time. (B) Polymerization of 1.5 μM ATP-actin in the presence of 4 μM profilin and Sca1515-Qdot, Sca401-1515-Qdot, and Qdot-Sca1023. Arrows point to Qdot-Sca2 constructs (red) bound to actin filament barbed ends (green). White asterisk indicates filament-buckling events. The plot on the right of Sca1515-Qdot illustrates the growth of the actin filament shown on the left, before (green) and after (red) its association with Sca1515-Qdot. (Scale bars, 1 μm.) (C) Elongation rates of actin filaments alone (black) or in the presence of Sca2 constructs and profilin, as indicated by color-coded labels. At least eight filaments were measured for each construct. (D) Exponential fits of the percent of Sca2 constructs (red, Sca1515-Qdot; blue, Sca401-1515-Qdot; green, Qdot-Sca1023) associated with filament-barbed ends over time (dots). The calculated half lifetimes and number of measurements are: Sca1515-Qdot (t1/2 = 1,050 ± 40 s, n = 61), Sca401-1515-Qdot (t1/2 = 707 ± 28 s, n = 32), Qdot-Sca1023 (t1/2 = 361 ± 8 s, n = 107).
