Fig. 1.
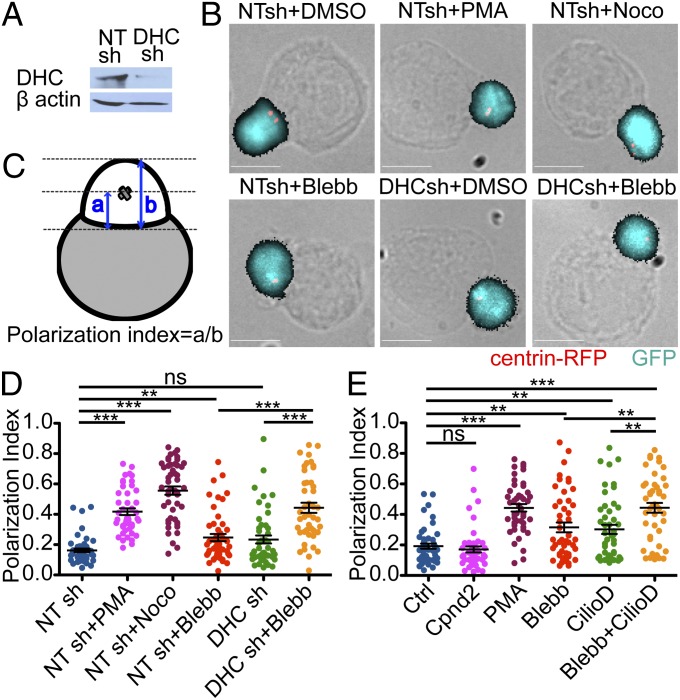
Dynein and NMII collaborate during centrosome polarization in T cell–APC conjugates. (A–C) T-cell blasts (5C.C7) expressing the indicated GFP-marked shRNAs together with centrin-RFP were mixed with antigen-loaded CH12 cells and imaged after fixation. Cells were treated with 5 ng/mL PMA, 33 μM nocodazole, 50 μM blebbistatin, or vehicle control (DMSO) as indicated. (A) Validation of DHC shRNA knockdown by immunoblot, with β actin serving as a loading control. NT, nontargeting shRNA control. (B) Representative fluorescence images are shown overlaid onto their corresponding bright-field images. (Scale bars: 10 μm.) (C) Schematic showing the calculation of polarization index. (D) Quantification of polarization index in fixed conjugates (n ≥ 44 conjugates per condition). (E) Centrosome polarization in fixed conjugates treated with DMSO vehicle, 5 ng/mL PMA, 50 μM ciliobrevin D, 50 μM negative control compound for ciliobrevin D (compound 2), 50 μM blebbistatin, or 50 μM ciliobrevin D in combination with 50 μM blebbistatin (n ≥ 45 conjugates per condition). Error bars in D and E denote SEM. P values were calculated using the Mann–Whitney test. ***P < 0.001; **P < 0.01; *P ≤ 0.05; ns, P > 0.05.

