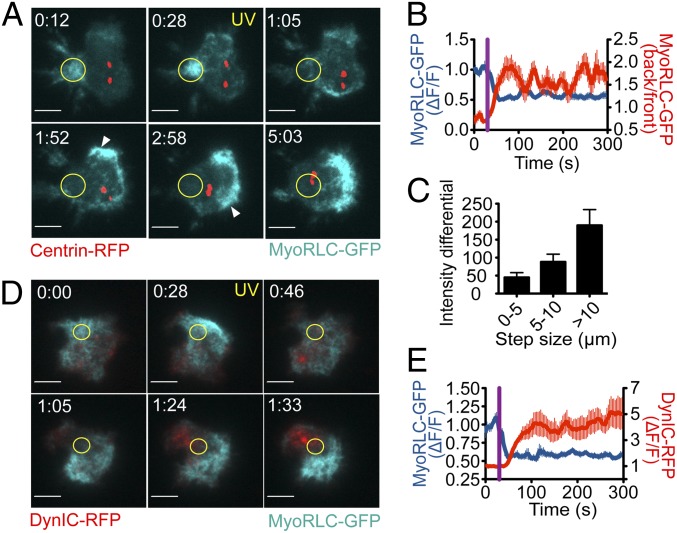
Fig. 3.
Reciprocal localization of NMII and dynein after TCR activation. Photoactivation experiments were performed using 5C.C7 T cells expressing MyoRLC-GFP together with either centrin-RFP (A–C) or DynIC-RFP (D and E). MyoRLC-GFP and DynIC-RFP were imaged using TIRF microscopy, and centrin-RFP was imaged with epifluorescence. (A and D) Representative time-lapse montages, with the time of UV irradiation indicated by yellow text. Yellow circles denote the irradiated region in each experiment. Arrowheads in A show MyoRLC-GFP clusters. Time is indicated as minutes:seconds at the top of each image. (Scale bars: 5 μm.) (B and E) Quantification of MyoRLC and DynIC dynamics (n ≥ 10 cells for each curve). Exclusion of MyoRLC from the irradiated region (B and E) and recruitment of DynIC to the irradiated region (E) are shown as ΔF/F, which is normalized background corrected mean fluorescence intensity (MFI). MyoRLC rearrangement was also assessed by calculating the MFI ratio between the back and the front of the T cell (B) (see also SI Materials and Methods). (C) Correlation between centrosome step size and differential accumulation of MyoRLC around the centrosome, calculated at each time point by subtracting the MyoRLC MFI in front of the centrosome from the MFI behind centrosome. Data are sorted based on the step size of the centrosome at the same time point (n = 10 cells; see also SI Materials and Methods). Error bars indicate SEM.

