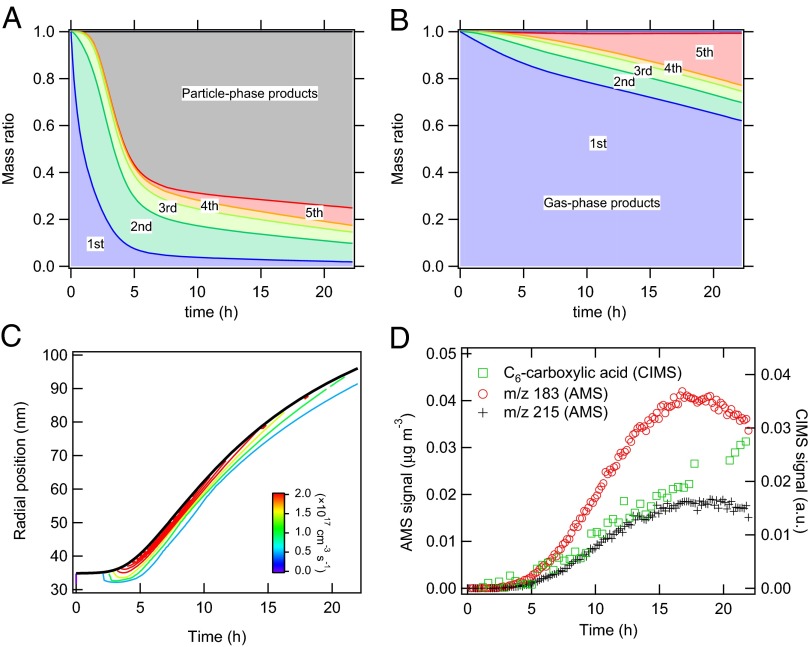
Fig. 3.
Relative contribution and distribution of gas-phase and particle-phase reaction products. Mass concentration ratios of multigeneration dodecane gas-phase oxidation products (colored) and particle phase products (gray) in the particle phase (A) and the gas phase (B), modeled with the multiphase scenario. (C) Modeled radial profile of the production rate (cm−3⋅s−1) of particle-phase products for an initially 35-nm radius particle. The solid black line indicates the evolution of the particle radius. (D) Temporal evolution of a C6-carboxylic acid (tracer for aldehyde/reactive carbonyl) in the gas phase monitored by the CIMS. Two characteristic tracers of peroxyhemiacetal formation in the particle phase are measured by the AMS at m/z 183  and m/z 215
  .
.

