Fig. 3.
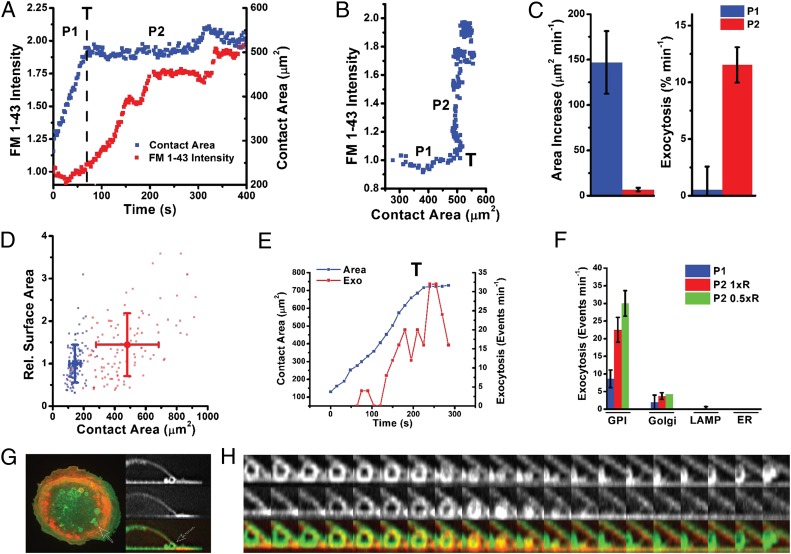
The transition promotes membrane remodeling. (A) FM 1–43 intensity and cell-contact area dynamics for a single cell during frustrated phagocytosis. Exocytosis (intensity increase) occurs following the transition, T. P1 and P2 indicate the phases before and after the transition, respectively. (B) FM 1–43 intensity versus contact area for the cell in A. An intensity increase occurs only once cells have passed through the transition. (C) Average rates of contact area and FM 1–43 intensity (exocytosis) increase during P1 and P2 (quantified from nine cells). Error bars show SEM. (D) Cell plasma membrane area (FM 1–43 intensity in arbitrary units) versus spread area (area of the cell in contact with the substrate) before (suspension cells just touching down on the substrate, blue dots) and after 30 min of frustrated phagocytosis (spread cells, red dots). Each point represents one cell. Mean and SD for each condition are shown. (E) Quantification of GPI exocytosis events and cell-contact area for a cell passing through the transition. (F) Comparison of exocytosis rates observed for four compartments (GPI, Golgi, LAMP, and ER) before (P1) and after (P2) transition and following a subsequent hypotonic shock (0.5 × R; R, ringer). (G) (Left) Overlay of PM-GFP and Ruby-Lifeact fluorescence in a macrophage spreading on IgG (arrow with dotted outline indicates vesicle before fusion). (Right) PM-GFP (Top), Ruby-Lifeact (Middle), and overlay of a cross-section through the cell in the Left panel containing a vesicle (Bottom). (H) PM-GFP (Top), Ruby-Lifeact (Middle), and overlay (Bottom, viewed from side) showing actin recruitment and subsequent shrinkage and fusion of the vesicle into the ventral surface (10 s per frame) (Movie S4).

