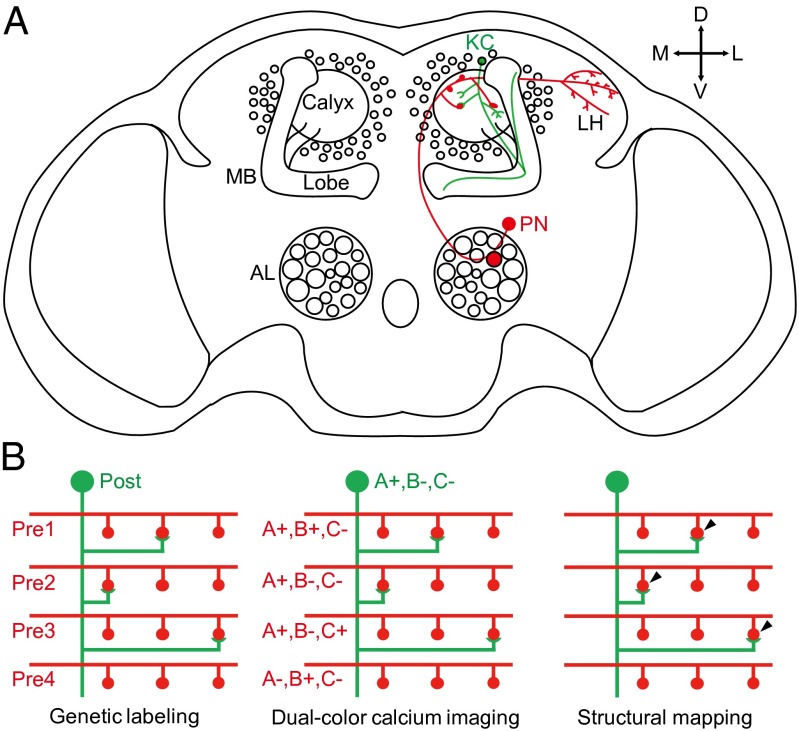
Fig. 1.
Illustrations of the MB calyx and the mapping strategy. (A) Structure of the MB calyx and its location in the Drosophila brain. The shape of a typical PN is shown in red and a typical KC is shown in green. AL, antennal lobe; MB, mushroom body; LH, lateral horn; PN, projection neuron; KC, Kenyon cell; D, dorsal; V, ventral; M, medial; L, lateral. (B) Illustration of the mapping strategy. First, neurons are genetically labeled so that a single postsynaptic neuron “post” and all presynaptic neurons “pre” express calcium indicator proteins of different colors (green and red). Dual-color calcium imaging is then used to map the response properties (e.g., to the three stimuli A, B, and C) of the postsynaptic neuron (e.g., responding to stimulus A only, represented as A+, B−, and C−) and all of the presynaptic terminals, regardless of their connectivity. Structural mapping is then carried out to identify the actual sites of synaptic contacts (post with pre 1, 2, and 3), and the presynaptic partners of the single postsynaptic neuron could then be pooled together for analysis. In this illustration, all three presynaptic inputs responded to A whereas only one of them responded to B and C, explaining the response pattern of the postsynaptic neuron.

