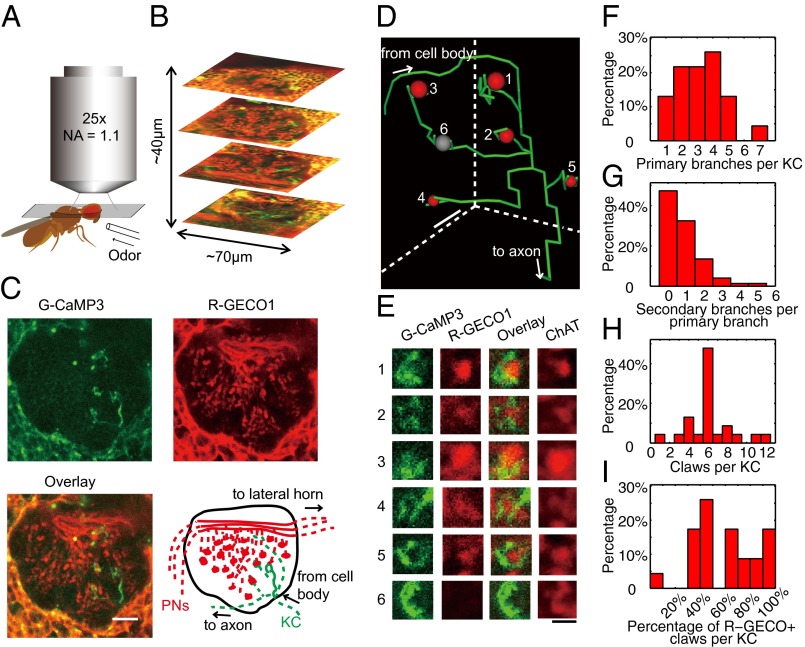
Fig. 2.
Mapping the presynaptic inputs of single KCs. (A) Experimental setup for in vivo structural and functional mapping. (B) The entire MB calyx was mapped by repeating single-plane imaging along the Z-direction. (C) Example structural image of a MB calyx in vivo, in which a single KC expressed G-CaMP3 and many PNs expressed R-GECO1. The complete image stack is shown in Movie S1. Interpretation of the image is shown in the illustration, where dashed lines indicate neurites that were above or below the focus of view. (D and E) Based on the structural images, the 3D structure of the entire KC dendrite was traced, and all of the KC claws were numbered and inspected to locate the corresponding PN axon terminals (first three columns in E). For this KC, five of the claws (except row 6) encircled PN axon terminals expressing R-GECO1. The PN axon terminal encircled by claw no. 6 could be revealed after immunostaining (final column in E). Diameter of the KC was exaggerated in D for illustration. (F) Histogram of the number of primary branches per KC. (G) Histogram of the number of secondary branches per primary branch. (H) Histogram of the number of claws per KC. (I) Histogram of the percentage of claws per KC that encircle PN axon terminals expressing R-GECO1. (Scale bars: C and D, 10 µm; E, 3 µm.)

