Fig. 3.
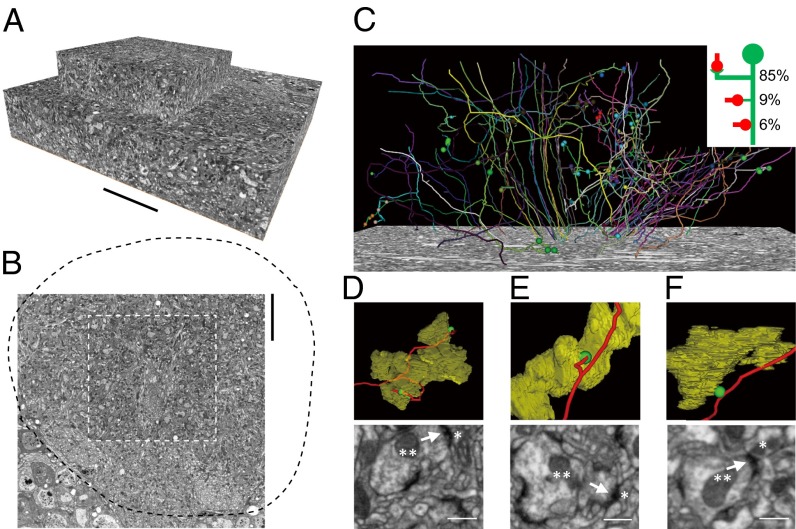
EM analysis of the MB calyx. (A) Total image volume acquired. (B) Location of the acquired volume in the calyx. The black dashed line outlines the calyx, and the white dashed line outlines the rectangular area covered by the top cube. (C) Three-dimensional structures of 59 reconstructed single KCs. Balls indicate synapses from PN axon terminals to the traced KCs. The synapses can be classified into three types, with their frequencies of occurrence shown in the Inset. (D–F) Synapses from PN axon terminals to KCs that were made onto a claw (D), a filopodia-like ending (E), and the shaft of a branch (F). (Upper) Reconstructions of the volume-rendered PN axon terminals (yellow), skeletons of the KCs (red), and locations of synapses (green balls). (Lower) The actual EM images for the identification of synapses. A double asterisk indicates a PN axon terminal; a single asterisk indicates a KC; arrows point to synapses. (Scale bars: A and B, 10 µm; D–F, 0.5 µm.)

