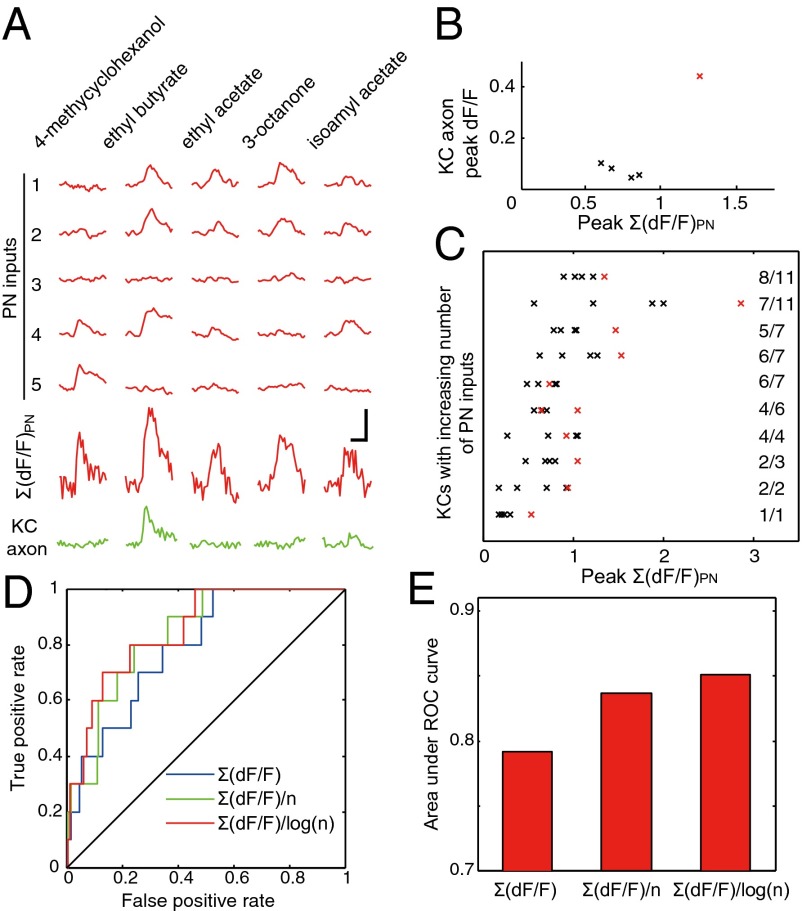
Fig. 5.
Predicting the output of single KCs from inputs. (A) Odor-evoked responses recorded from the axon and the PN inputs of a single KC. (B) Relationship between the response amplitude of the summed PN inputs and the axon output for the KC in A, with each cross representing peak response amplitudes evoked by a single odor. The odor (ethyl butyrate) that evoked a significant axon response is in red. (C) Relationship between the response amplitude of the summed PN inputs and axon activation for all of the odor-responsive KCs. Crosses in red indicate significant responses at the KC axon. The number at the end of each line indicates the number of PN inputs covered by R-GECO1 divided by the total number of PN inputs. (D) ROC curves for binary classifiers based on Σ(dF/F)PN, Σ(dF/F)PN/n, and Σ(dF/F)PN/log(n). (E) Comparison between the areas under ROC curves. (Scale bars in A, 2 s, 50% dF/F.)

