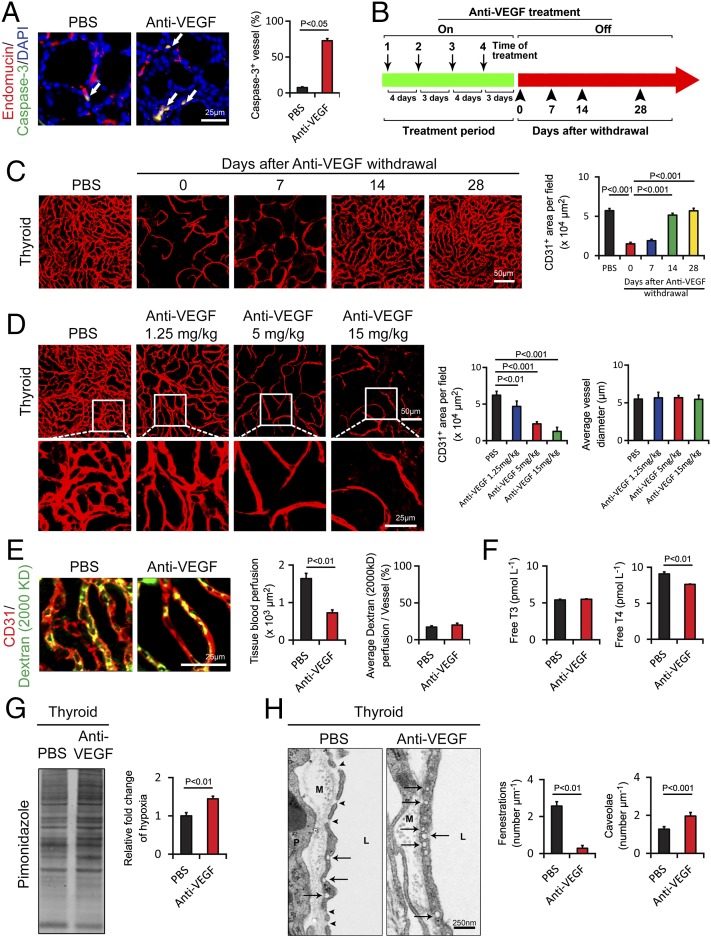
Fig. 5.
Endothelial cell apoptosis, cessation-induced vascular recovery, time course, tissue hypoxia, vescular fenestration, and thyroid functional alterations in response to anti-VEGF treatment. (A) At 2 wk after treatment with VEGF blockade, paraffin-embedded thyroid tissue sections were triple immunostained with an anti–caspase-3 antibody (green), an anti-endomucin antibody (red), and DAPI (blue). Arrows point to endothelial apoptotic cells. Caspase-3+ apoptotic endothelial cells were quantified (n = 8 per group). (B) Schematic diagram showing the treatment regimen and cessation of anti-VEGF therapy. On, on drug; Off, off drug. (C) Thyroid vascular alterations in response to VEGF blockade and withdrawal of treatment at various time points. CD31+microvessels in thyroid tissues of anti-VEGF–treated and nontreated groups were quantified (n = 8 fields per group). (D) Thyroid vascular alterations in response to various doses of VEGF blockade and quantification of vascular CD31+ density and the average of vascular diameter (n = 8 fields per group). (E) Vascular perfusions were double immunostained with CD31 (red) and a lysinated fluorescein-labeled dextran (2,000 kDa; green). Total tissue and individual vessel perfusion were quantified (n = 8 fields per group). (F) Serum levels of thyroid hormone free T3 and free T4 as measured using an ELISA method (n = 3 samples per group). (G) Quantification of tissue hypoxia in response to anti-VEGF treatment (n = 3 samples per group). (H) Thyroid vascular fenestrations in anti-VEGF–treated and nontreated tissue samples and numbers of fenestrae and caveolae were quantified (n = 8 samples per group). M, matrix; P, perivascular cell; L, lumen. Arrows point to caveolae, and arrowheads indicate fenestrae. Data are presented as means ± SEM.

