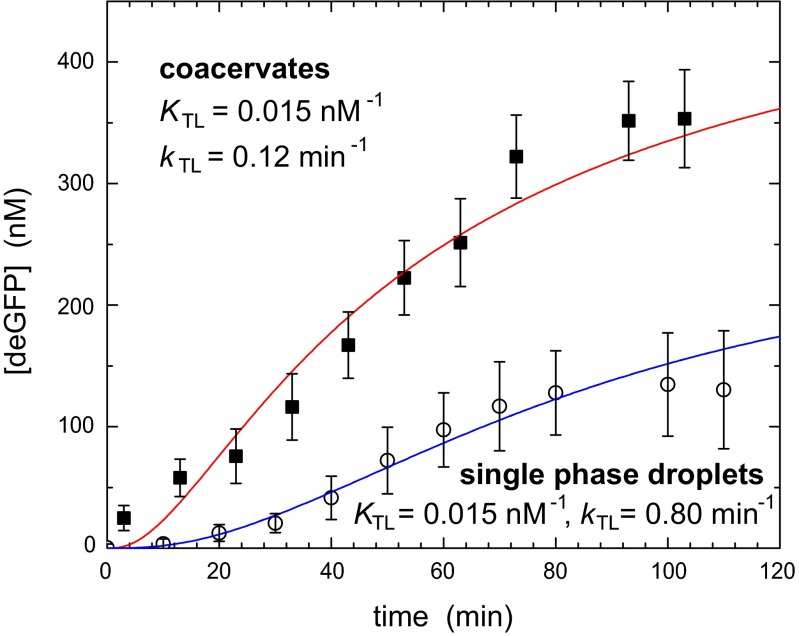
Fig. 4.
Protein expression in coacervates. deGFP production in droplets and coacervates. The open symbols represent single-phase droplets, and the closed symbols represent coacervates. The solid lines are model predictions for equilibrium ribosome binding constants and translation rate constants as indicated by the labels (see SI Text, S16 for details on other parameters). The coacervate data are modeled with the actual concentrations of all macromolecular components and enhanced transcription binding and rate constants KTS = 10 nM−1 and kTS = 143 min−1, respectively (Fig. 3B), compared with the single-phase droplets.

